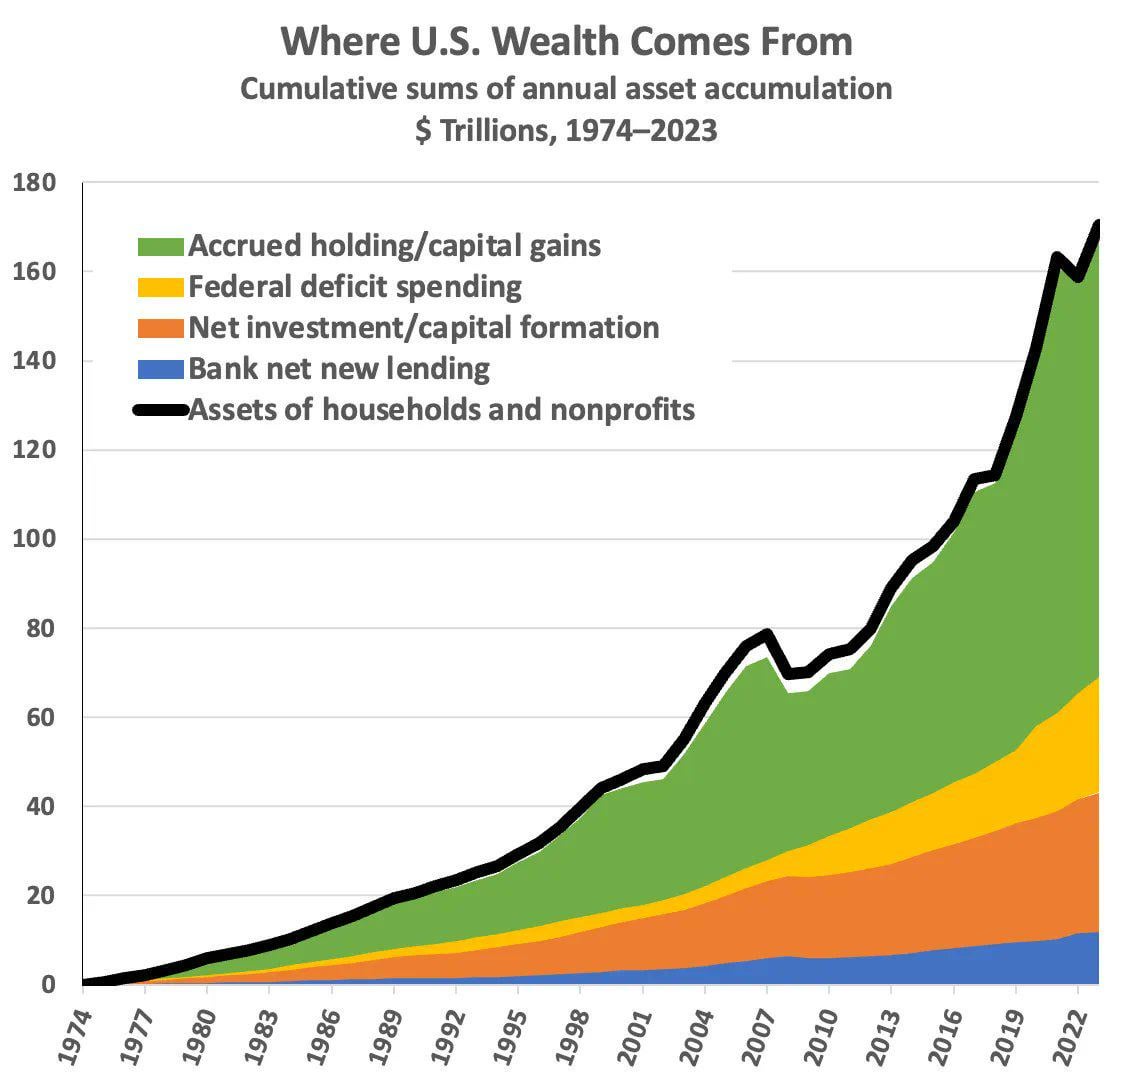
Also it’s important to note, that the green category includes pension funds, which will be the largest asset for a lot of people.
Similarly if you own a house and paid off the mortgage – that asset appreciating in value will probably fall into the green category too (it’s even visible how in 2008 many households lost their homes, see how that dent is mostly in the ,,green” area)
Your paycheck will fall into the orange category, since it’s simply adding new money into your new worth.
What this really shows, is that compound interest is how you get rich – the paycheck can only get you so far.
And why does it start at zero in the seventies?
Apologies for my ignorance in advance: would this chart also be a rough approximation for the factors that contribute to the overall monetary supply/inflation?
Both via direct stimulus (MMT) and circulation of money through the economy?
And why is that a bad thing?
Wealth (ideally) comes from the voluntary exchange and subjective value. Here’s a quick example:
Adam makes chairs and has one for sale. He has no money. Bob wants to buy a chair. He has $10. Before the transaction, the total amount of money is $10. The total value is also $10.
Adam is happy to sell a chair for $5. Put another way, he values the $5 more than the chair. Bob is happy to buy one for up to $7. Put similarly, he values a chair more than the $7. Bob pays Adam $5 for the chair. Now Adam has $5, while Bob has a chair (bought for $5) + $5.
The total amount of money & material has stayed the same ($10 + a chair), but the total value has increased: Adam got $5 (which he prefers to a chair), Bob paid $5 for something he values at $7. The net result is an increase in value: $2 in wealth.

6 comments
[https://wealtheconomics.substack.com/p/where-does-wealth-really-come-from](https://wealtheconomics.substack.com/p/where-does-wealth-really-come-from)
Why are they not including for-profit companies?
Also it’s important to note, that the green category includes pension funds, which will be the largest asset for a lot of people.
Similarly if you own a house and paid off the mortgage – that asset appreciating in value will probably fall into the green category too (it’s even visible how in 2008 many households lost their homes, see how that dent is mostly in the ,,green” area)
Your paycheck will fall into the orange category, since it’s simply adding new money into your new worth.
What this really shows, is that compound interest is how you get rich – the paycheck can only get you so far.
And why does it start at zero in the seventies?
Apologies for my ignorance in advance: would this chart also be a rough approximation for the factors that contribute to the overall monetary supply/inflation?
Both via direct stimulus (MMT) and circulation of money through the economy?
And why is that a bad thing?
Wealth (ideally) comes from the voluntary exchange and subjective value. Here’s a quick example:
Adam makes chairs and has one for sale. He has no money. Bob wants to buy a chair. He has $10. Before the transaction, the total amount of money is $10. The total value is also $10.
Adam is happy to sell a chair for $5. Put another way, he values the $5 more than the chair. Bob is happy to buy one for up to $7. Put similarly, he values a chair more than the $7. Bob pays Adam $5 for the chair. Now Adam has $5, while Bob has a chair (bought for $5) + $5.
The total amount of money & material has stayed the same ($10 + a chair), but the total value has increased: Adam got $5 (which he prefers to a chair), Bob paid $5 for something he values at $7. The net result is an increase in value: $2 in wealth.