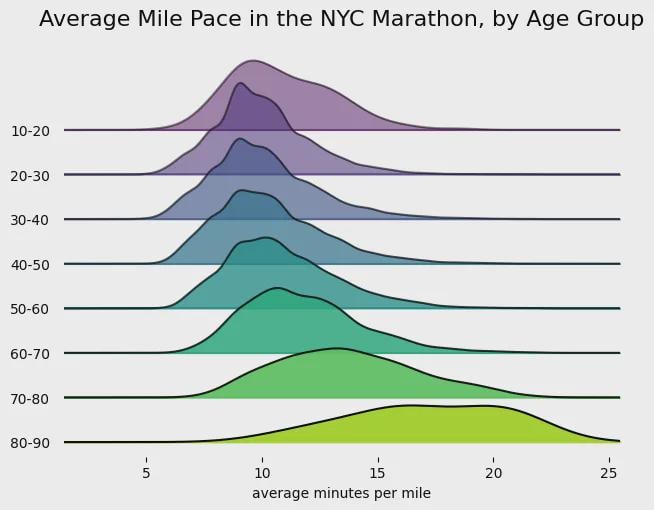
I had fun analyzing data from the NYC marathon, which was this past weekend. I made this chart in python with the joypy library, my first time using it. You can access the data in this google sheet if you’re interested: [https://docs.google.com/spreadsheets/d/1O_zxndHKhKMIfJ9e7_M5L7b4F3S__d1nVnUS8iZn8yE/edit?gid=0#gid=0](https://docs.google.com/spreadsheets/d/1O_zxndHKhKMIfJ9e7_M5L7b4F3S__d1nVnUS8iZn8yE/edit?gid=0#gid=0)
So you can be among the best in the world until your mid forties. That’s something.
Nice looking chart. I’ll have to try joypy sometime. The chart title made me think I could learn what the average mile pace would be for a given age group, however, I’m only seeing the distribution of paces. An updated title or maybe some indicator for average in each distribution could help align the chart and the title.
Also surprised how similar the distributions are for everyone between 20 and 60. Some impressive 50-60 year olds in NYC!! Thanks for sharing!
This is why the WHO considers everyone below 60 as “Young”
As far as your body is concerned until your mid 60s you are a slightly out of shape 30 yr old (if you are healthy)
70 is when shit kicks the fan unfortunately
Very interesting! If the data exists to display, it might be even more revealing to break the youngest age group into two, since “10-20” covers everything from actual children to people in the peak of their athletic prime.
90 year olds still beating my ass.
Damn, those 10 year old fast as shit.
How is anyone doing a marathon with a 25 minute mile pace? That’s almost 11 hours to finish the run.
I didn’t realize the average pace was over 10 mins/miles.
I’d be interested in seeing the 10-20 age group further broken down.
I dream to one day be the 80 year old that can run a sub-10 marathon, my god
11 comments
I had fun analyzing data from the NYC marathon, which was this past weekend. I made this chart in python with the joypy library, my first time using it. You can access the data in this google sheet if you’re interested: [https://docs.google.com/spreadsheets/d/1O_zxndHKhKMIfJ9e7_M5L7b4F3S__d1nVnUS8iZn8yE/edit?gid=0#gid=0](https://docs.google.com/spreadsheets/d/1O_zxndHKhKMIfJ9e7_M5L7b4F3S__d1nVnUS8iZn8yE/edit?gid=0#gid=0)
And see my full analysis of it here:
[https://residualthoughts.substack.com/p/marcelo-and-karolina-the-fastest](https://residualthoughts.substack.com/p/marcelo-and-karolina-the-fastest)
So you can be among the best in the world until your mid forties. That’s something.
Nice looking chart. I’ll have to try joypy sometime. The chart title made me think I could learn what the average mile pace would be for a given age group, however, I’m only seeing the distribution of paces. An updated title or maybe some indicator for average in each distribution could help align the chart and the title.
Also surprised how similar the distributions are for everyone between 20 and 60. Some impressive 50-60 year olds in NYC!! Thanks for sharing!
This is why the WHO considers everyone below 60 as “Young”
As far as your body is concerned until your mid 60s you are a slightly out of shape 30 yr old (if you are healthy)
70 is when shit kicks the fan unfortunately
Very interesting! If the data exists to display, it might be even more revealing to break the youngest age group into two, since “10-20” covers everything from actual children to people in the peak of their athletic prime.
90 year olds still beating my ass.
Damn, those 10 year old fast as shit.
How is anyone doing a marathon with a 25 minute mile pace? That’s almost 11 hours to finish the run.
I didn’t realize the average pace was over 10 mins/miles.
I’d be interested in seeing the 10-20 age group further broken down.
I dream to one day be the 80 year old that can run a sub-10 marathon, my god
Comments are closed.