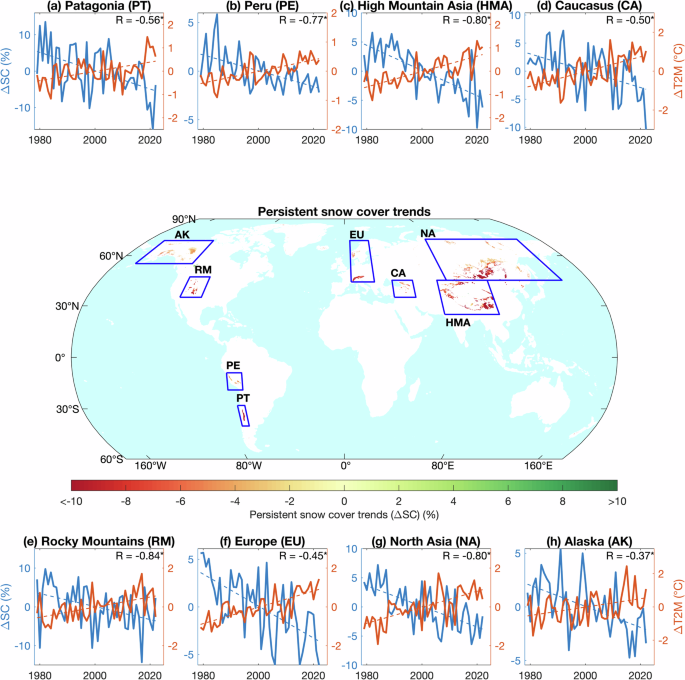
Figure 1 shows that the snow cover in mountain regions with an interseasonal snow persistence of more than 190 days experienced a significant decline in snow cover from 1979 to 2022, based on ERA5L reanalysis data. The mountain topography and snow cover in the different regions have distinct heterogeneous patterns6. Persistent mountain snow cover changes with significant trends tested with a non-parametric Mann-Kendal test with a 95% confidence level were identified over the American and Eurasian continents with a global mean decline of 7.79%. By clustering mountains with significant snow cover trends and based on their geographic location, eight mountain regions emerge, including Patagonia, Peru, High Mountain Asia (including Himalayas, Hindu Kush, and Tian Shan), Caucasus, Rocky Mountains, European Mountains (including Alps and Scandinavian), North Asia (including Altai and Verkhoyansk), and Alaska (Fig. 1 and Supplementary Fig. S1; Supplementary Table S1; see “Methods” Section).
The line plots show the areal mean timeseries anomalies (solid line) and their trend (dashed line) of snow cover (blue) and surface air temperature (orange). The areal mean was calculated for persistent snow cover grid points including (a) Patagonia (PT), (b) Peru (PE), (c) High Mountain Asia (HMA), (d) Caucasus (CA), (e) Rocky Mountains (RM), (f) Europe (EU), (g) North Asia (NA), and (h) Alaska (AK). In the main panel, the shaded region shows persistent mountain snow cover trends from ERA5L reanalysis data. All trends are significant at a 95% level based on a Mann-Kendal test. The regions from a) to h) are highlighted with overlayed blue boxes (details are in Supplementary Table S1).
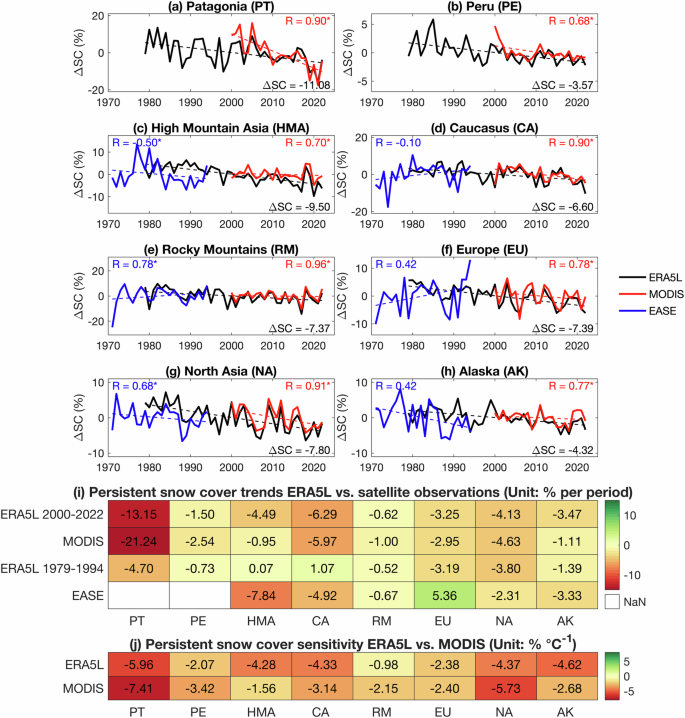
The areal mean anomaly timeseries of persistent snow cover showed a strong negative trend coinciding with an increase in surface air temperature in the last 44 years (Fig. 1). The snow cover trends are not uniformly distributed between the regions; therefore, we hypothesize an important role of local processes to amplify or dampen the temperature trend. For instance, the most substantial decline in snow cover was in Patagonia (~13.15%); contrary, Peru and Alaska showed the weakest trends in snow cover (Fig. 2).
Presented are anomaly timeseries for snow-persistent grid points in (a) Patagonia, (b) Peru, (c) High Mountain Asia, (d) Caucasus, (e) Rocky Mountains, (f) Europe, (g) North Asia, and (h) Alaska. The heat maps compare the trend in overlapping periods (i) of ERA5 and MODIS and EASE satellite observations and (j) snow cover sensitivity to temperature changes. In (a–h), ERA5L data are in black, MODIS data are in red, and EASE Grid NH data are in blue. Note that the EASE data only cover the northern hemisphere and are not available for Patagonia and Peru. The time coverage differs between the data set (ERA5L: 1979–2021, MODIS: 2000:2022, EASE: 1971–1994). The numerical in (a–h) indicates the trend for ERA5L (black) and the correlation coefficient between ERA5L and EASE (blue) and MODIS (red) anomaly timeseries.
We used MODIS and EASE-Grid satellite products from NASA to add validation of the performance of the ERA5L reanalysis data (Fig. 2 and Supplementary Fig. S1). Previous studies reported an overestimation of snow cover and related variables from ERA5L with pattern distribution resembling observations reasonably well38,39,40,41,43,44. We found less negative trends from ERA5L compared to MODIS (Fig. 2i). In particular, in the Northern Hemisphere in the Rocky Mountains, Europe, North Asia, and Alaska, the snow cover trend values match those from MODIS observations well. The snow cover sensitivity of ERA5L resembled the values of the satellite observations adequately (Fig. 2j). Therefore, despite the reported biases in ERA5L surface air temperature values40,42, we found the reaction of snow cover to surface temperature trends from ERA5L is reliable (Fig. 2j). The comparison with EASE snow cover data available for the northern hemisphere revealed a larger mismatch in the 1980s and 1990s (Fig. 2). While ERA5L showed a snow cover increase in High Mountain Asia and Caucasus, the EASE indicated a widespread decline in the mountain cover with a maximum over High Mountain Asia (Fig. 2i). The correlation coefficients of the anomaly timeseries between ERA5L and MODIS were generally high with all being statistically significant. The correlation coefficients between ERA5L and EASE, in contrast, were generally lower. Only in High Mountain Asia, the Rocky Mountains, and North Asia the correlation coefficients between snow cover anomaly timeseries from ERA5L and EASE were significant (Fig. 2). A spatial comparison of the mean states of snow cover data from ERA5L and MODIS reveals a match with significant pattern correlation coefficients above 0.6 in all regions (Supplementary Fig. S1). The pattern correlation is weaker in warmer areas of the subtropics and tropics, while the confidence of ERA5L increases in cooler high-latitude regions of the Northern Hemisphere and High-Mountain Asia.
We want to refer to previously published works for their concise evaluation of other variables defining snow cover conditions. Despite the positive bias in the monthly mean values, the trends in snow depth from ERA5L were consistent with those from Snow-CCI and GlobSnow39,43. The NASA data comparison highlights the varying snow cover estimates from different datasets, emphasizing the complexities and uncertainties in measurement. However, the snow depth trend in ERA5L reanalysis data aligns with those in GlobSnow, validating its utility for analyzing snow depth trends. Further, ERA5L was found to capture the accumulations such as snowfall, snowmelt, and snow depth in water equivalent best among currently available reanalysis products on a global scale45,46. This analysis enhances the confidence in the reliability of ERA5L reanalysis to detect and analyze snow cover changes in snow-persistent mountains in recent decades.
Dependency on global warming
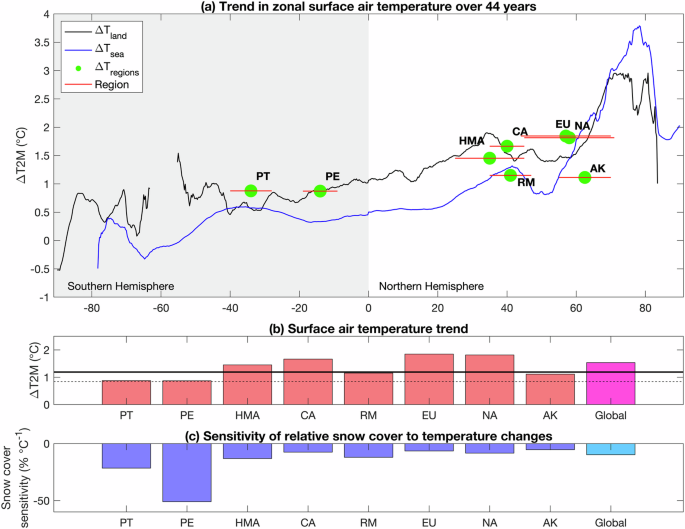
Figure 3a shows the mean surface air temperature trend for each region and the zonal mean surface air temperature trends over land. ERA5L has a global warming trend of 0.84 °C and a global mountain warming trend of 1.19 °C over 44 years, with varying magnitudes at different latitudes47. An uneven rate of warming is evident in mountain regions, which aligns with Pepin et al.48. Further, Fig. 3a demonstrates a distinct warming pattern with strong amplification in the polar regions in the Northern Hemisphere. Both land and ocean regions show this Arctic amplification, with warming over the ocean being stronger than over land49,50. The land amplification factor51,52, the ratio of the zonal mean temperature trend to the trend in global mean temperature53,54, increased in high latitudes and was evident for land grid points in both hemispheres. Hence, the warming trend over land was stronger compared to the ocean warming; however, the opposite is true between 60°N and 80°N. (Fig. 3a).
a Zonal mean surface air temperature trend for land in black line and ocean in blue line. The green-filled circles indicate trends over considered regions and latitudinal middle points. The shaded area signalizes the southern hemisphere. b The red bars indicate the local mean surface air temperature trends, where the dashed line represents the mean global warming rate, which is 0.84 °C between 1979 to 2022. The solid line represents the mean global warming on mountains (with more than 1 km altitude) is 1.19 °C between 1979 to 2022. c Shows snow persistence sensitivity, defined as the relative snow cover trend to its temperature trend.
The regional mean surface air temperature trend of the eight mountain ranges resembles the zonal mean warming trend. In Peru and Caucasus, the temperature trends represent the zonal mean land warming at their latitudinal position; Patagonia, North Asia, and Europe warmed at a higher rate (Fig. 3a). In contrast, High Mountain Asia, the Rocky Mountains, and Alaska showed a weaker than land warming rate52. A unique case is Alaska, which revealed a distinct dampened warming rate compared to the mean land latitudinal warming despite its northern position. Therefore, besides Alaska, warming is strongly amplified in regional boxes in the northern hemisphere (Fig. 3b).
We used temperature dependence to show the role of warming trends on relative changes in persistent snow cover in each region (Fig. 3c). On a continental scale, the snow cover trends in the northern hemisphere showed differing intensity and significance6. The snow cover decline in mountain regions indicates that the response to warming is non-linear; A non-proportional relationship between the snow cover decline and surface temperature increase is apparent. The persistent mountain snow cover in the Southern Hemisphere (Fig. 3b and c), specifically in Peru and Patagonia, demonstrates a higher sensitivity to regional warming. In contrast, snow cover showed relatively weak sensitivity to temperature changes in regions with stronger warming in the Northern Hemisphere—Caucasus, Europe, and North Asia. This heterogeneous pattern of snow cover change was supported by previous studies based on AI-modeling data (1982–2020)5 and MODIS satellite observations (2000–2018)4. The results give reason to consider other aspects to explain the decline in the persistent snow cover.
Snow-mass fluxes in transition
Bormann et al.6 hypothesized varying strengths of accumulation and ablation determined the heterogeneous distribution of trends in persistent mountain snow cover. The dominant variables impacting snow cover and depth are total precipitation, snowfall, snow melt, and sublimation. They, in turn, can modulate near-surface air temperature and skin temperature31. Variations in precipitation mainly impact the snow cover by fluctuations in the inflow of snow as a primary source of snow mass10,43,44,55,56. Consequently, the snowfall ratio of total precipitation and the snow accumulation ratio at the surface are important factors determining snow cover persistence5,8,43,44,56. Snow persistence and snow cover deviations modulate surface albedo and impact temperature of the surface and the bordering air57,58,59,60. Reversely, air temperature impacts the precipitation-snowfall ratio55,59,60. The surface radiation budget is an important puzzle piece to elaborate and conclude on relevant processes determining temperature and mass changes at a snow-covered surface58,61. A strong, significant correlation reflects this relationship between snow cover and mass and energy fluxes (Supplementary Fig. S2). All relevant variables are available from ERA5L. Despite a reported overestimation of mass38,39 and energy41 fluxes, the dataset is suitable for the present trend analysis. Based on this preliminary analysis, total precipitation/snowfall and snow melt emerge as major factors that explain persistent mountain snow cover.
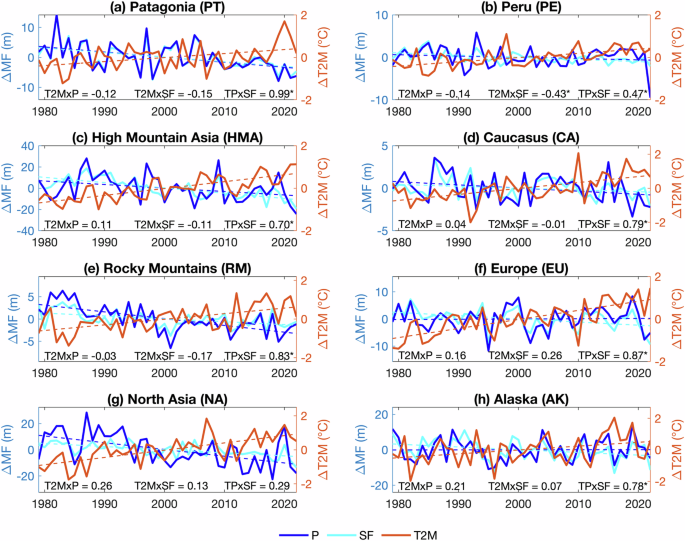
Surface air temperature anomalies are anti-correlated with snowfall anomalies. Peru exhibits the strongest anti-correlation (RPxT2M = −0.86), which coincides with the strong sensitivity of snow cover and surface air temperature (Fig. 3c) and a significant correlation between total precipitation and snowfall anomalies. However, the correlation between temperature anomalies and anomalies in total precipitation and snowfall is non-significant in most regions indicating a decoupling of the two variables (Fig. 4). Whereas snowfall anomalies and precipitation anomalies showed a strong, significant positive correlation in most of the regions (Fig. 4), where Peru (RPxSF = 0.47; Fig. 4b), High Mountain Asia (RPxSF = 0.70; Fig. 4c), and North Asia (RPxSF = 0.29; Fig. 4g) exhibit weaker correlation. Different reasons for determining precipitation anomalies are discussed, such as the effect of teleconnections of natural climate variability12, e.g., of the El Niño Southern oscillation, on the interannual variability of orographic monsoon precipitation in the Himalayas62 and the Andes16.
The anomaly timeseries of the areal sum of total precipitation and snowfall in Patagonia (a), Peru (b), High Mountain Asia (c), Caucasus (d), Rocky Mountains (e), Europe (f), North Asia (g), and Alaska (h). The variables illustrated are anomalies in total precipitation (P, blue) and snowfall (SF, cyan), including their trends (dashed line). Overlaid is the areal mean surface air temperature anomaly with the trend (red). Each pair of panels shows the results for one of the eight regions. The numerical indicate the correlation coefficients between surface air temperature and total precipitation (T2MxP), the correlation coefficients between surface air temperature and snowfall (T2MxSF), and the correlation coefficients between total precipitation and snowfall (PxSF), with asterixis (*) marking significant values (95% confidence interval). The correlation coefficients were calculated for detrended timeseries.
In most regions other than Peru, Europe, and Alaska, total precipitation has a significant negative trend. The trend in Peru is negligible, while Europe and Alaska have slight positive precipitation trends. In contrast, the snowfall trend is negative in all regions. Distinct patterns are observed in those regions where snowfall trend and precipitation trends diverge most. To the end of the study period, there are negative snowfall anomalies that occur decoupled from positive precipitation anomalies (Figs. 4b, c, f, and h). Therefore, in those regions, the snowfall fraction of total precipitation changes in favor of rainfall.
Peru was home to the largest glaciated tropical region and experienced substantial interannual variability of the Pacific Ocean, which impacted precipitation, snowfall, and temperature12,16. Therefore, it is natural that Peru experienced precipitation led by internal variability. Still, snowfall is decoupled and decreased with increasing temperatures, giving a potential explanation for the high sensitivity of snow persistence. A strong correlation between snow cover anomalies and snowfall, surface air temperature, and snowmelt further leads to the conclusion that internal variability is a leading driver for snow cover fluctuations in Peru and Patagonia (Supplementary Fig. S2). In the other regions, precipitation anomalies lead to snowfall anomalies; snowfall trends oppose the surface air temperature trends in all regions, while total precipitation shows heterogeneous trends in different regions.
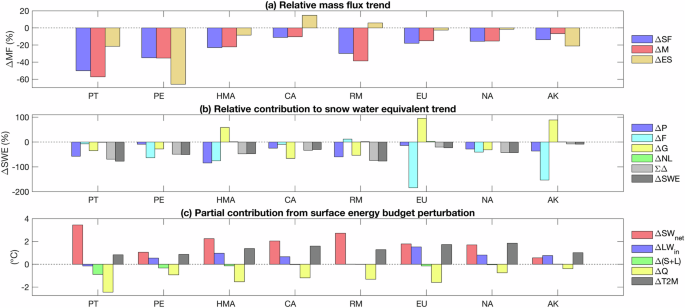
A negative snowfall trend was associated with a positive temperature trend (Fig. 5a; Supplementary Fig. S3). The decrease in snowfall coincides with a reduced snowmelt mass flux. Therefore, snowfall was a primary source of meltwater generation. In conclusion, negative snowfall trends trigger a reduction in snowmelt. The trend analysis highlights the heterogeneity in processes characterizing the snow conditions in the different mountain regions. In some regions, the negative trend in snowfall is stronger than the reduction in snowmelt; therefore, the warming trend shifted the mass fluxes in favor of ablation instead of reducing accumulation contributing to the decline in snow cover properties in High Mountain Asia, Caucasus, Europe, North Asia, and Alaska (Fig. 5a). In the other mountain regions (Patagonia, Peru, and Rocky Mountains), the trend analysis points to a shift toward a more substantial reduction of accumulation than the reduction of ablation (Fig. 5a). Snow evaporation/sublimation shows negative trends in most mountain regions, except in Caucasus and the Rocky Mountains; However, their trends and the residual term are negligible due to their low magnitude (Supplementary Fig. S3).
Changes in mass fluxes and in the surface energy budget in Patagonia (PT), Peru (PE), High Mountain Asia (HMA), Caucasus (CA), Rocky Mountains (RM), Europe (EU), North Asia (NA), and Alaska (AK). The bar plots in (a) compare the relative trend of snowfall \((\Delta {\rm{SF}})\), snowmelt \((\Delta {\rm{M}})\), and snow evaporation/sublimation \((\Delta {\rm{ES}})\). In (b) the bars represent the relative contribution of changes in total precipitation (\(\Delta P\)), of changes in the fraction of total precipitation fallen as snow (\(\Delta F\)), of changes in the fraction of fallen snow remaining at the surface (\(\Delta G\)), and of changes due to the non-linear term (\(\Delta {NL}\)). The total relative changes in snow depth in water equivalent calculated by the four terms (\(\sum \Delta\)) should equal the observed snow depth in water equivalent (\(\Delta {SWE}\)) from ERA5L. The terms are relative contributions to \(\sum \Delta\), while \(\sum \Delta\) and \(\Delta {SWE}\) represent the change relative to their mean state. c shows the linear decomposition of the surface energy balance into partial temperature contributions of changes in shortwave radiation (SWnet), in downwelling longwave radiation (LWin), in the turbulent heat fluxes (S + L), and in the heat stored at the surface (Q). Due to an error in ERA5L from September 2022 onwards, we only considered 43 hydrological years from 1979 to 2021 for the decomposition of the surface energy balance.
Drivers for snow depth depletion
In all regions, the decline in persistent snow cover coincides with a significant reduction in snow depth and snow water equivalent. We linearly decomposed linear snow depth changes to reveal possible drivers of the total snow depth trend expressed in snow water equivalent and derive physical mechanisms. Three contributing terms are adding to the change in snow water equivalent, including the change in total precipitation, the change in the ratio of total precipitation falling as snowfall (snowfall ratio), and the change in the ratio of accumulated snow that does not melt (snowfall accumulation ratio)43,44,56 (Fig. 5b and Supplementary Fig. S4). The dominant drivers for changes in snow depth alter across different regions, reflecting the heterogeneity of their environmental conditions7,56. Changes in total precipitation had a major role in only three regions—Patagonia, High Mountain Asia, and Rocky Mountains (Fig. 5b)—where other factors also had considerable contributions, supporting the effect of precipitation changes. In most regions, changes in the snowfall ratio and snowfall accumulation ratio are dominant drivers of snow depth changes. Where snowfall decreased at a higher rate than snowmelt increased, the snowfall ratio was dominant (High Mountain Asia, Europe, and Alaska; Fig. 5), and vice versa.
In Patagonia, precipitation changes are the dominant contributor explaining the snow depth decline supported by snowmelt, while in Peru, changes in the snowfall ratio were a dominant driver for the snow depth decline (Fig. 5b). Therefore, in Patagonia, a tandem of reduced precipitation and increased snowmelt are principal drivers for snow depth depletion; however, the snowfall ratio remains nearly constant. Consequently, the precipitation reduction is directly proportional to the snowfall reduction in this region (Figs. 4a and 5a). Further, the enhancement of precipitation leads to a reduction of the snowfall ratio, resulting in snow depth thinning in Peru, which supports our hypothesis that snowfall with warming results in high snow depth depletion supported by the snowfall accumulation ratio27 (Fig. 5a).
The regions in the mid-latitudes show a variety of possible explanations for snow depth change. In High Mountain Asia, the decline in total precipitation and the snowfall ratio explains the decrease in snow depth48 (Figs. 4c and 5b). These changes may be due to a reduction of seasonal precipitation and a reduced snowfall ratio due to warmer temperatures. The stronger reduction in snowfall compared to an increase in snowmelt manifests our findings (Fig. 5).
In Caucasus, contributions of changes in the snowfall accumulation ratio play a dominant role in snow depth thinning, while the other terms contribute with only small magnitudes (Fig. 5b). The surface warming and intensified melting process can explain this trend (Fig. 5a). Also, the strong increase in snowmelt in the Rocky Mountains resulted in a substantial contribution to snowfall accumulation (Fig. 5). The contribution of changes in total precipitation has a subordinate role.
There is a tendency to increase the contribution of changes in the snowfall ratio towards high latitudes in the northern hemisphere. Over Europe and Alaska, the reduction in snowfall lowers the snowfall ratio, contributing most to snow depth changes (Fig. 5). However, the contribution of the change in total precipitation and the snowfall accumulation ratio contradict this negative trend or are negligibly negative. Only in North Asia is the contribution of the snowfall ratio predominant, while the contribution of changing total precipitation and changing snowfall accumulation ratio act with similar magnitude. This may be due to the colder temperature, which does not modulate precipitation much; however, melting, sublimation, and reduced snowfall contribute to the change in snow depth56 (Fig. 5).
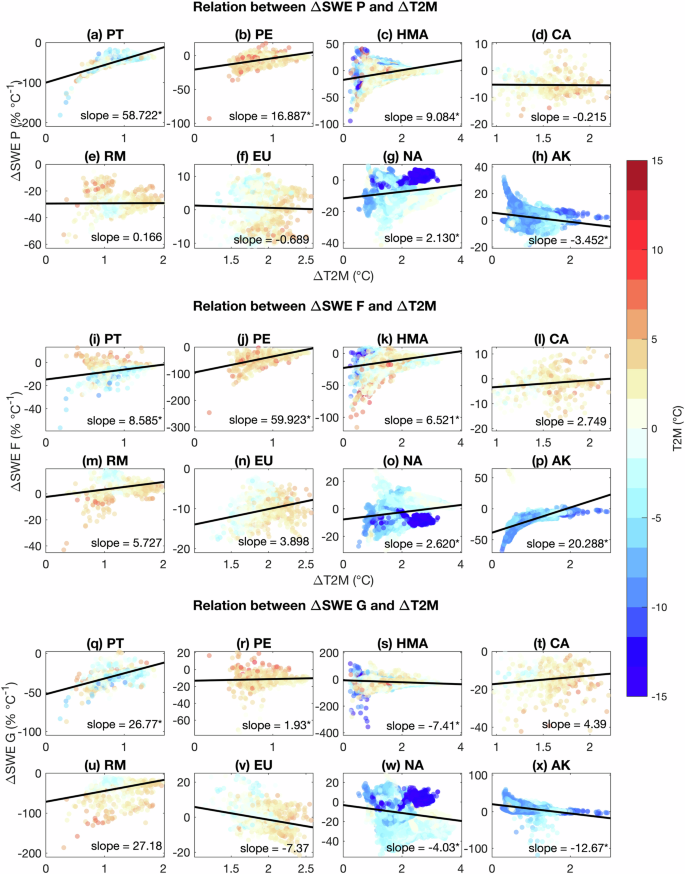
On a local scale, we identified two groups of regional environmental setups, which show similarities in the processes determining the snow depth changes despite the heterogeneity of identified drivers of snow depth thinning (Fig. 6). The first group includes low- and mid-latitude mountain ranges, which are characterized by a considerable amount of snow persistent grid points well above the freezing point, including Patagonia (T2M = 0.19 °C), Peru (T2M = 3.42 °C), Caucasus (T2M = 2.42 °C), and the Rocky Mountains (T2M = 2.40 °C). The second group, mountain ranges with a cold environment in high latitudes or extreme heights, include High Mountain Asia (T2M = −3.37 °C), Europe (T2M = 0.67 °C), North Asia (T2M = −4.60 °C), and Alaska (T2M = −6.09 °C).
The connection between the contributions of total precipitation (a–h), snowfall fraction (i–p), and snowfall accumulation fraction (q–x) with the temperature trends in all eight regions on a local scale (grid-by-grid). Presented are relative changes per one-degree temperature change. The colors indicate the mean temperature. The numbers show the slope of the regression line with asterixis (*) indicating significant values (95% significance level).
In the first group, the higher temperature leads to an overall negative snowfall accumulation rate and negative contributions of total precipitation (Fig. 5b). Only locally, where temperatures are high and the contribution of total precipitation and snowfall fraction are in phase, does snowfall have low positive contributions to snow depth (Fig. 7a), e.g., in the Rocky Mountains (Fig. 6m). In sum, this leads to the strong thinning of snow depth.
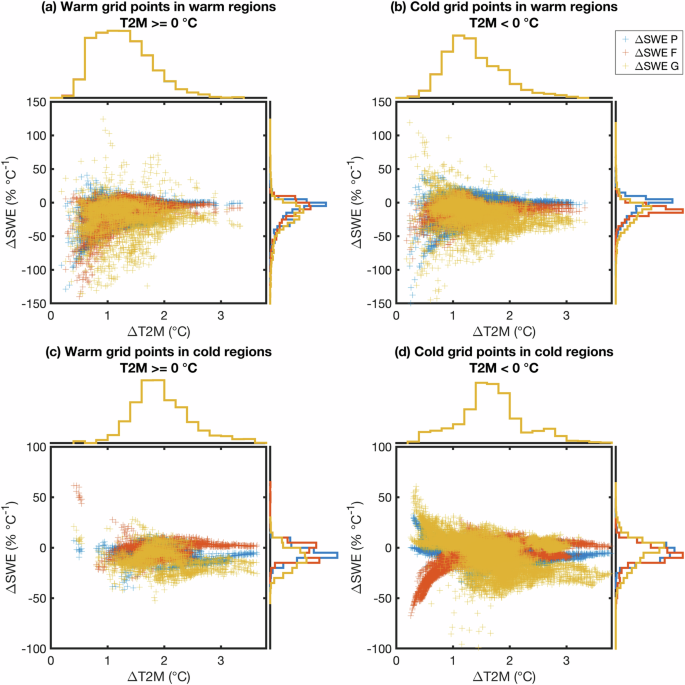
Relative snow depth changes due to changes in total precipitation (blue), snowfall fraction (red), and snow accumulation (orange) per one-degree temperature increase. The plot distinguishes between grid points in warmer (a and b) and cooler regions (c and d). a shows grid points with above-zero mean surface air temperatures and (b) below-zero mean surface air temperatures in warmer regions. c, d shows the results for above and below-zero mean surface air temperature in the cold mountain regions, respectively. The scatter plot shows the relative snow depth change terms per temperature change against the regional temperature trends.
In the second group, cold mean temperatures below the freezing point are predominant. Contributions due to total precipitation are positive in colder gridpoints (Fig. 6), where the warming trend increases the water-holding capacity of the atmosphere. However, at the same time, the contributions of the snowfall fraction are strongly negative as the increase in precipitation coupled with a reduction in snowfall considerably shrinks the snowfall fraction (Fig. 7c). At locations where temperatures are higher, the contributions of total precipitation are negative, and those of the snowfall fraction are positive (Fig. 7d). At the same time, a considerable number of locations show positive contributions to the snowfall accumulation ratio, leading to the reduced thinning or even thickening of the snow layer. Nevertheless, the decline in snow depth affects all regions in both groups.
Based on Fig. 7, we can hypothesize a physical mechanism dependent on surface air temperature. The surface air temperature is too warm in warmer regions for snow to accumulate, leading to an overall negative contribution. The decline in total precipitation and snowfall are in phase (Fig. 4). In conclusion, the trend in total precipitation leads the trend in snowfall, while the snowfall fraction remains at a similar level. Therefore, in warmer regions, the contribution of snowfall fraction is relatively low, and the decline of snow depth is mainly attributed to changes in total precipitation and the accumulation fraction (Fig. 7a and b), which is also partly valid in warmer grid points of the cold regions (Fig. 7c). In the cold regions, in turn, the temperatures are cold enough for snow to accumulate, leading to the positive snowfall accumulation term. Further, the strong decline due to the snowfall fraction leads to the conclusion that precipitation falls more extensively on warm days, while snowfall and precipitation decline on cold days. Therefore, there is a shift towards more liquid phase precipitation, expressed by a strong negative contribution of snowfall fraction, while the contribution of total precipitation is regionally positive (Fig. 7d), which can also be observed in cold areas of the warmer regions (Fig. 7b).
In short, snow ablation is due to snowmelt, and a small portion is due to snow evaporation, which, in sum, overcompensated snow accumulation by snowfall. Overall trends favored stronger ablation or weaker accumulation due to a decrease in snowfall that was either determined by a general decline of total precipitation and a warming trend or by the warming trend alone. The latter changes the snowfall ratio. The snowfall accumulation ratio supported this reduction of snow depth and dominated in regions where the snowfall ratio did not decline proportional to the total precipitation. The non-linear term played a minor role in explaining changes in snow depth. In conclusion, our findings indicate that a decrease in snowfall and an increase in snow melting relative to snowfall contribute to an overall decrease in persistent snow cover.
Moreover, the results highlight the presence of diverse drivers influencing trends in snow depth. Furthermore, our findings contradict the findings by Pulliainen et al.7 who found a more significant decline in snow cover in North America on a continental scale compared to Eurasia. Therefore, we can conclude that there is a need to address trends in mountain snow cover on different mountain ranges individually as they differ from the continental-scale trends. By examining the region-by-region perspective, we find no singular dominant mechanism governing the decline in mountain snow cover on a global scale. Therefore, the global perspective presented in this study is essential for comprehending trends in the persistent snow cover in mountain regions.
Finally, we want to discuss the results in light of the dataset used; ERA5L is a new dataset that has been applied in similar studies in Northern Europe44 and the Northern Hemisphere43. In those studies, the trend values and the contributions of the explanatory variables achieved good agreement with other reanalysis datasets and against station observations in terms of spatial pattern and magnitude of trends. Despite the reported positive biases for precipitation and snow depth38,40,42, the results of previous trend analysis38,39 and the decomposition method43,44 gave reliable output.
Surface energy implications to regional mountain warming
The interplay of snow cover fluctuation and regional warming rate can be attributed to various factors, including elevation-dependent climate processes, surface energy feedback mechanisms, and atmospheric circulation patterns. In the present study, we used a simple approach shown in Fig. 5c to understand the accelerated warming captured by changes in the surface energy balance57,58,59,60. The change in the individual fluxes supports the isolation of local drivers for the warming. The dominant contribution to warming comes from perturbation in the shortwave radiation budget (Fig. 5c)52. Changes in the surface albedo determined the changes in the net shortwave radiation. Albedo values are generally high with snow cover and decrease when snow cover diminishes57. This was also indicated by the strong positive correlation between snow cover and albedo (Supplementary Fig. S2b). In Alaska, the perturbation in the downward longwave radiation dominates the warming contributions (Fig. 5c). Alaska features positive snow depth contributions by the snow accumulation fraction, indicating that fallen snow is more likely to accumulate, damping the reduction of albedo values (Fig. 5). In Europe, the magnitude of warming induced by downward longwave radiation is strongest (Fig. 5c). The warming effect of downwelling longwave radiation may be related to other factors, such as increased cloud cover63, e.g., in the Alaska and Europe regions.
Changes in the turbulent heat fluxes counteracted the warming with changes in the radiative fluxes (Fig. 7). Turbulent heat fluxes captured the effect of changing land-atmosphere temperature gradient (sensible heat) and the effect of phase change of water and snow (latent heat)64. One component acting toward negative temperature contributions is related to the increase in snow evaporation and sublimation (Fig. 5). The phase change of snow to water vapor releases energy into the atmosphere, cooling the surface65. The sensible heat, in turn, has negative values once the surface is warmer than the atmosphere64. As snow cover melts and snow-covered area seasonally decreases, the surface warms up and releases heat to the atmosphere, resulting in a more negative turbulent heat effect. The ground heat had a weak and negligible contribution to the temperature change. In summary, the overall combination of the different feedback mechanisms52 triggered amplified warming over mountainous regions covered by persistent snow cover.
