UN WPP (2022); HMD (2023); Zijdeman et al. (2015); Riley (2005) – with minor processing by Our World in Data. “Life expectancy at birth – Various sources – period tables” [dataset]. Human Mortality Database, “Human Mortality Database”; United Nations, “World Population Prospects 2022”; United Nations, “World Population Prospects”; Zijdeman et al., “Life Expectancy at birth 2”; James C. Riley, “Estimates of Regional and Global Life Expectancy, 1800-2001” [original data].
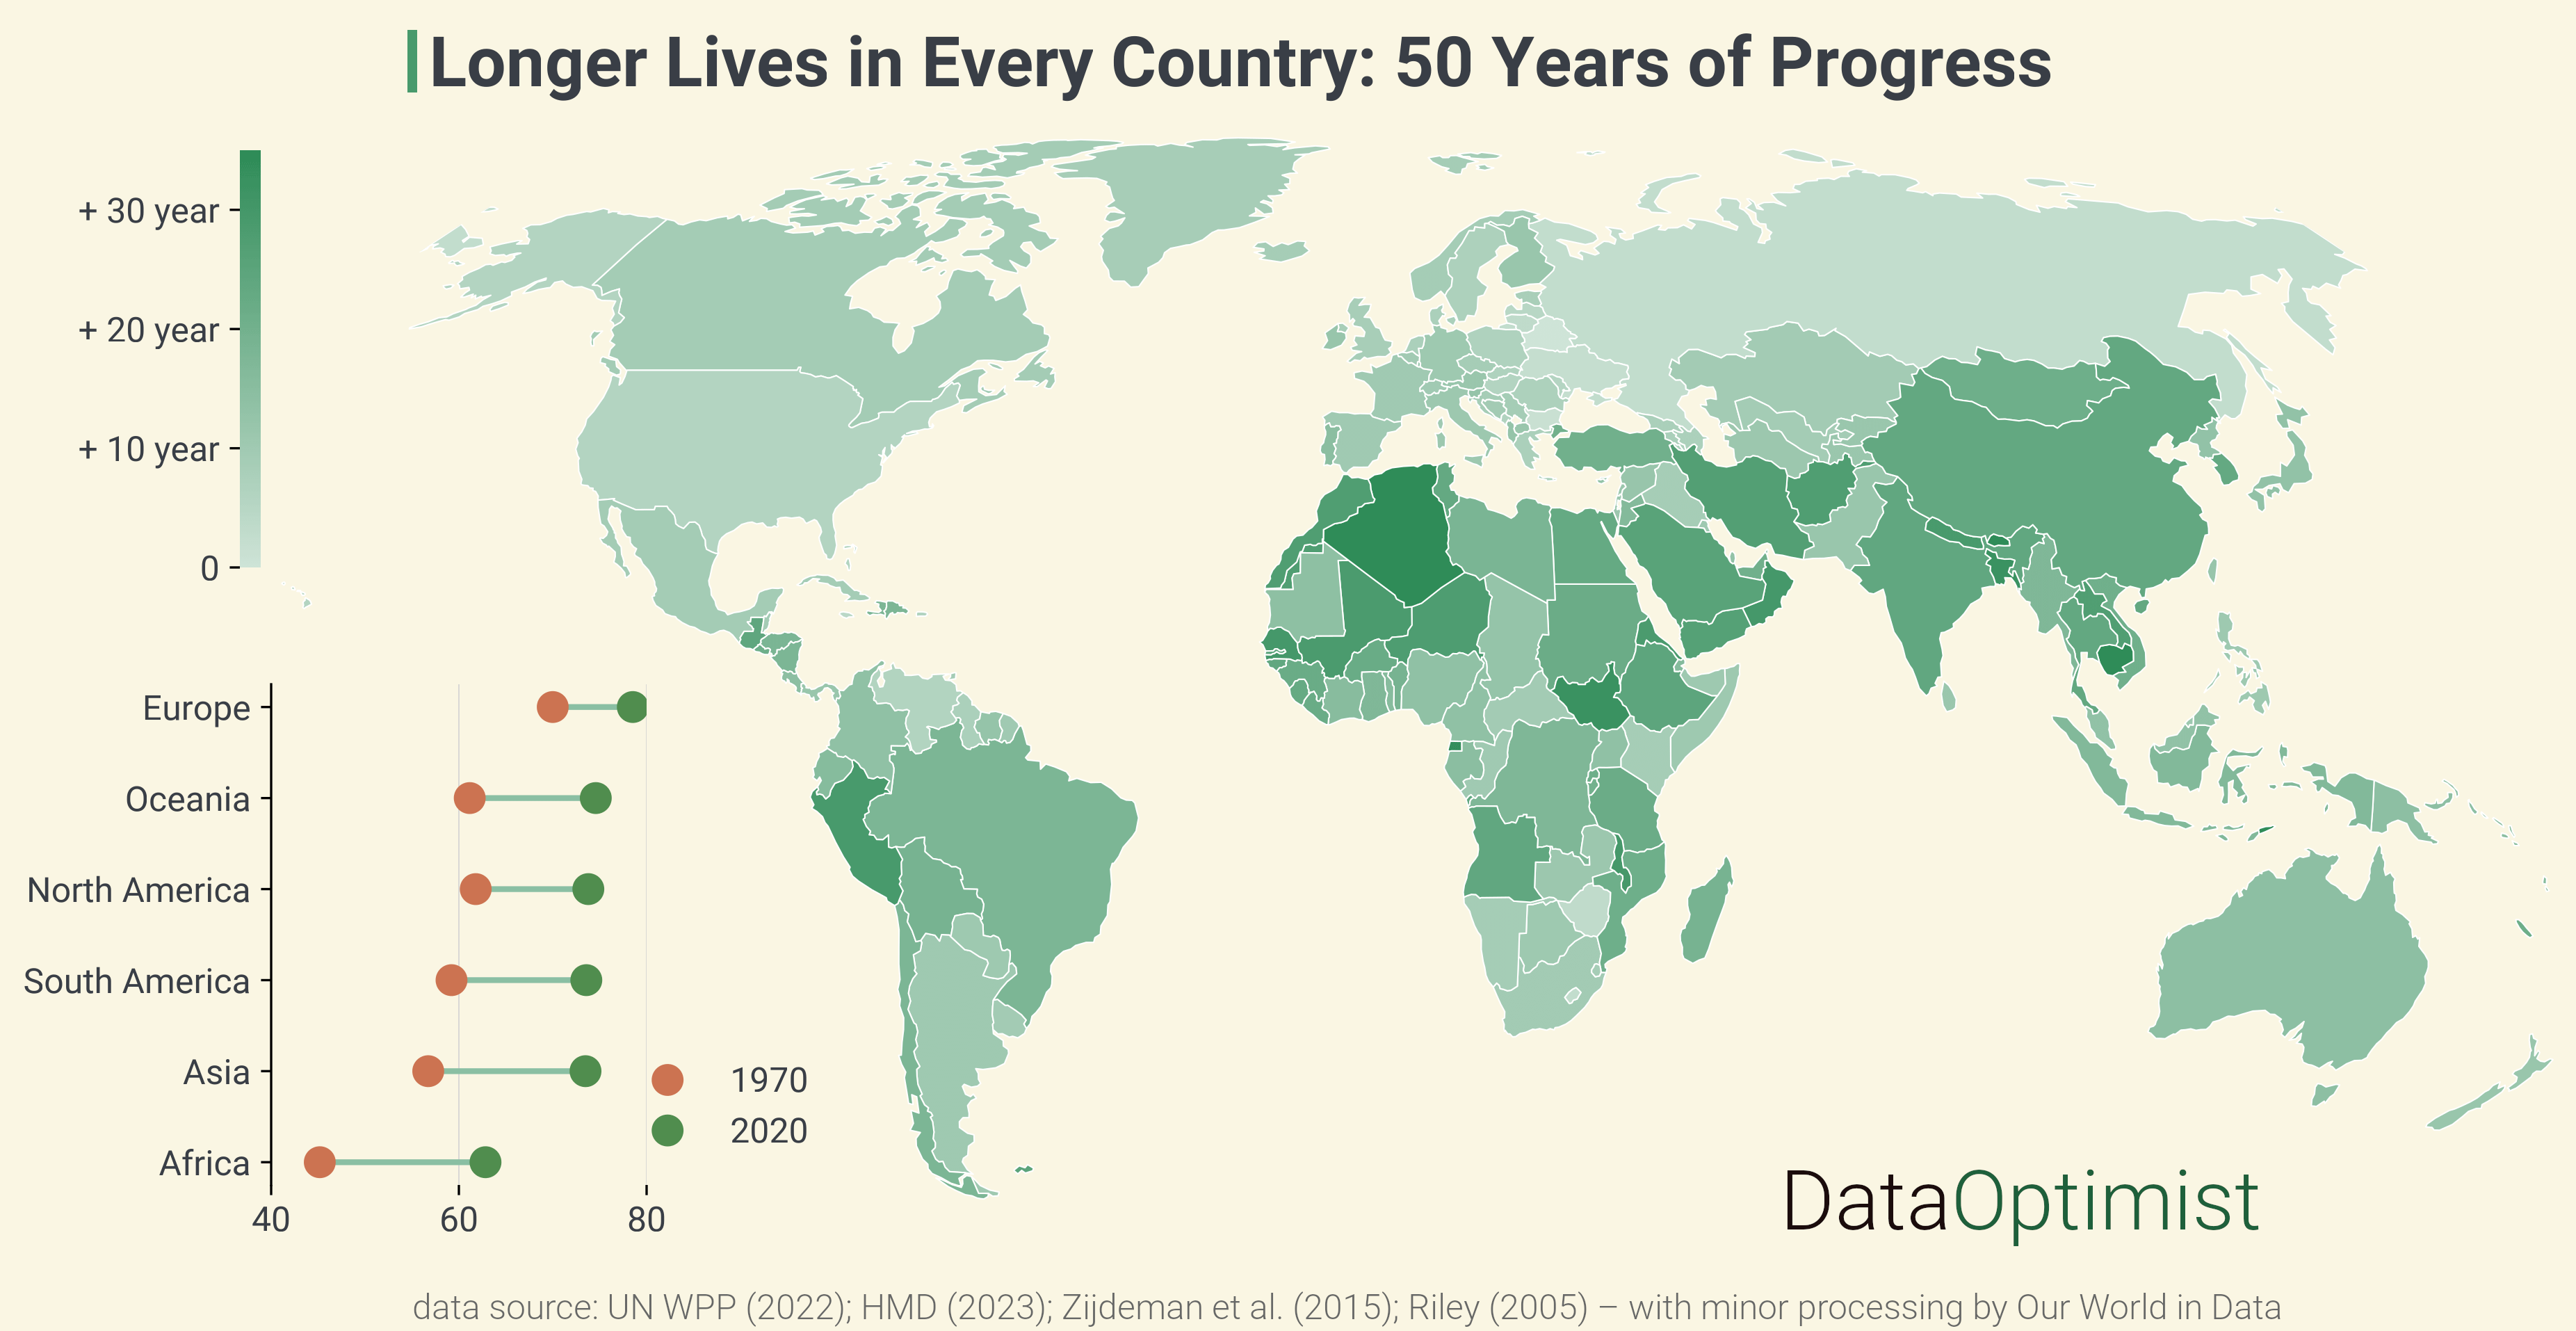
![Rising Life Expectancy Around the World: 1970–2020 [OC]](https://www.europesays.com/wp-content/uploads/2024/11/efhe2e0y240e1-1920x1024.png)
3 comments
Data: [https://ourworldindata.org/life-expectancy](https://ourworldindata.org/life-expectancy)
UN WPP (2022); HMD (2023); Zijdeman et al. (2015); Riley (2005) – with minor processing by Our World in Data. “Life expectancy at birth – Various sources – period tables” [dataset]. Human Mortality Database, “Human Mortality Database”; United Nations, “World Population Prospects 2022”; United Nations, “World Population Prospects”; Zijdeman et al., “Life Expectancy at birth 2”; James C. Riley, “Estimates of Regional and Global Life Expectancy, 1800-2001” [original data].
Tools: Python, packages: matplotlib, Cartopy & Seaborn
Sort of an example of regression to the mean. The bottom performers gained a lot more than the best performers.
Then there is Russia.
Yay! We went from really light green to really really light green!
Comments are closed.