MAP is the primary control of tropical tree cover and dominates in arid and semi-arid ecosystems, with rainfall distribution consistently the largest factor influencing stress (Table 1, Fig. 1, Supplementary Fig. 5). Limitation from MAP reduces relative tree cover by 11.6–39.6% (Table 1). MAP exerts the least control in wet forests (2.4–13.1%) and most in deserts (35.3–72.0%). Energy (i.e., MAT and SW combined) only has a small impact on tropical tree cover, primarily from co-limitation with MAP in mountainous areas (Fig. 1), impacting relative tree cover by 0–0.09% (Table 1).
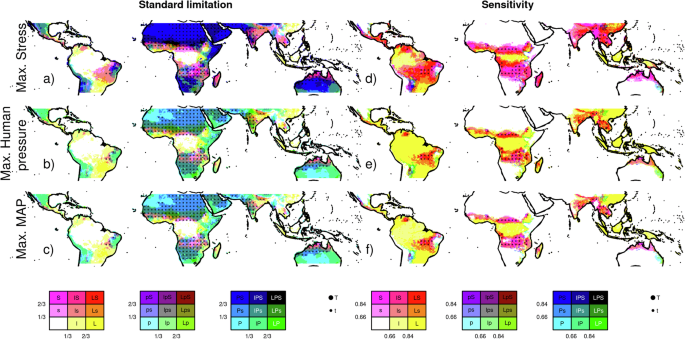
a–c Shows the relative standard limitation for each control and d–f normalised sensitivity of each factor. Purple shows areas limited by mean annual environmental stresses (S), yellow by human pressure from population density and land use (L), Cyan by Mean annual Precipitation (P) and dots by Mean Annual Temperature and Shortwave Radiation (T). Red represents co-limitation by S&L, blue by S&P, and green by L&P. Shades show the relative importance of the limitation, with darker, intense shades indicating a stronger impact, lighter shaded (and none-capitalised letter in legend) less impact, and white indicating little or no limitation – by definition coinciding with high tree cover. From top-bottom maximum stress, human pressure, and MAP limitation at 10% likelihood.
Limitation from environmental stresses (i.e., the combined stresses of rainfall seasonality, fire, heat stress and wind) occurs almost everywhere in the tropics, resulting in a 12.8–28.6% relative tree cover reduction (Table 1). We use four metrics as a proxy for rainfall seasonality: Fractional mean annual dry days, fractional number of dry days in the driest month, precipitation in the driest month, and mean seasonal precipitation concentration. The results presented here summarize the impact via performance-weighted contributions of all. Rainfall seasonality has the most considerable impact from all the stress controls, causing a relative tree cover reduction of 10.5–23.3%. It is particularly important in the seasonal, fire-prone savanna ecosystems (reducing relative tree cover by 19.5–30.3%) in Africa, Asia, Indonesia, Australia and Southern Amazonia, in the savanna-forest ecotone areas extending into the Southern Amazonian forest and the tropical forests of Central Americas (Fig. 2). These stresses co-limit with MAP over much of the tropics but dominate in some African and Australian savannas (Fig. 1).

Each row represents a different stress (top-bottom): a, b Fire (using burnt area), c, d heat stress, e, f windthrow, and g, h seasonal rainfall distribution. These are followed by human pressures: i, j population density, k, l urban area, m, n cropland area and o, p pasture area. For each stress or human pressure, two maps are shown: the left map represents the 10th percentile, and the right map represents the 90th percentile of the likely range of the stress’ impacts, illustrating the range of uncertainty in the estimated tree cover reduction. This figure allows for a visual comparison of both the magnitude of tree cover reduction by each stress and the confidence level (percentile range) associated with these reductions.
Limitation from human pressure (Land use and population) is important in southern Amazonia forests, Northern Andes and Chocó-Manabí Corridor and central tropical Indonesia, impacting relative tree cover by 29.8–36.8% (Table 1). All controls except energy limits tree cover in deciduous ecosystems. They are particularly affected by heat stress and rainfall seasonality, impacting relative tree cover by 12.1–34.6% and 21.0–35.4% respectively (Table 1).
The impact of fire relative to other stresses
Overall, fire (assessed using burnt area) has the least impact from the stressors tested, with a relative tree cover reduction of 0.20–3.2%. Its impact is smaller than heat stress (relative reduction of 6.31–22.8%, Table 1, p = 0.0001, Supplementary Table 1) and windthrow (3.0–8.7%, p = 0.061). Between ecosystems, fire impact is greatest in savanna/grassland (0.6–7.1%), though this is still less than rainfall seasonality, heat stress and windthrow (Fig. 3; P = 0.013, 0.020, 0.28, respectively). Most of the fire impact is in African savannas (Fig. 2).
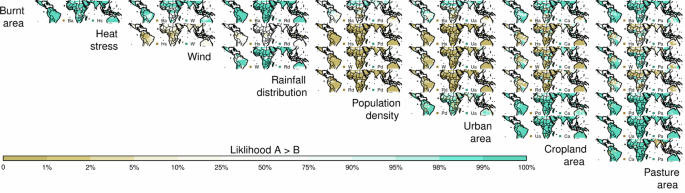
Each map in the grid shows indicates the likelihood of the column stress having a greater impact on tree cover reduction than the row stress. Blue areas represent regions where the column stress is more likely to cause a higher reduction in tree cover, while brown areas represent regions where the row stress has a higher likelihood. The stress or pressure’s first two letters or initials are listed next to the relevant colour for each map. For example, the top left blue areas show where Hs (Heat stress) reduces tree cover more than Ba (Burnt area). White indicates equal likelihood, and lighter shades of blue or brown show a slight likelihood difference between the column and row stress. The colour gradients allow for a visual comparison of how different stresses or pressures are likely to impact tree cover in various locations.
The fire’s impact is concentrated in warm, seasonal climates with moderate rainfall, predominantly the same regions of high burnt area (Fig. 4). Where MAP is between 100–2000 mm/yr, fire impact on tree cover increases as rainfall seasonality and MTWM increase. Fire only impacts tree cover above 2000 mm/yr in areas with extreme seasonality and high temperatures. Fire impacts occur in phenologically seasonal regions (Fig. 4), but not exclusively.
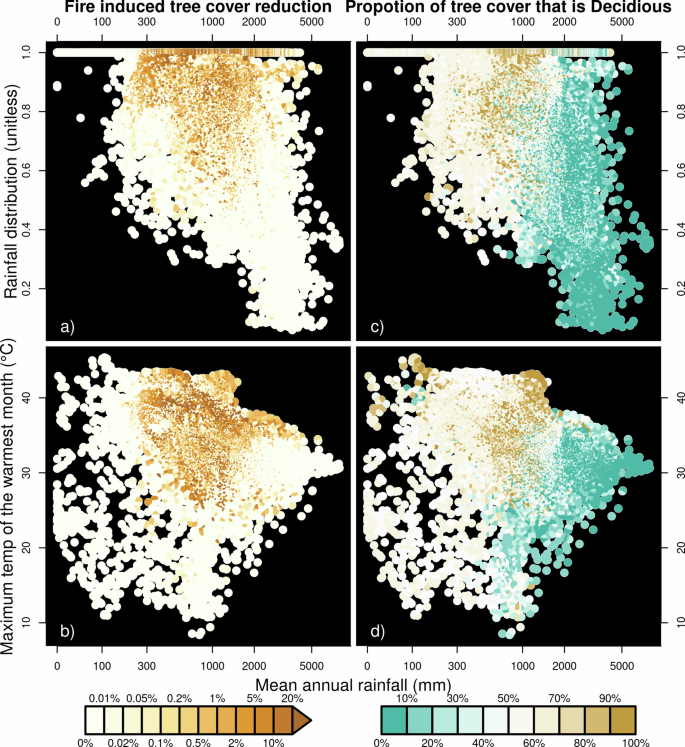
Dots indicate grid cells with (x-axis) Mean annual rainfall and (y-axis) rainfall seasonality for a, c and maximum temperature of the warmest month for b, d. a, b Colour indicated fire impact on tree extent and c, d percentage deciduous cover vs. evergreen (see methods).
Fire’s impact is significantly smaller than the 3.4–34.9% (P = 0.066–0.0003) across all FDGVMs in the fire model intercomparison experiments (FireMIP)6. FireMIP compared the difference between fire-on and fire-off experiments that both ran throughout the historic period. While similar to our experiment, the historic period may have had transient fire impacts on tree cover, such as fire regime shifts and deforestation fires, not tested by our framework. The significant and substantial impact, particularly in savanna climates, which have seen consistently high levels of burning for millions of years42 and are therefore less likely affected by transient effects, still suggests that FDGVMs fire impact on tree cover is too strong for some regions in the present day. However, humans can substantially diminish fire impact on tree cover in savannas. In areas where land use reduces tree cover, fire can only impact tree cover over this reduced area, and land use and active suppression tend to reduce burnt area in the tropics by inhibiting fire spread even in areas nearby but outside agriculture29,43. We quantify fire impact on tree cover without human influence by simulating the impact on tree cover from the burnt area we would expect to observe without human modification, which we obtained from29 (see methods) and without population density or land use influence on tree cover (Fig. 5). Without direct human impact, fire would limit tree cover by 0.3–5.2% – more comparable to FireMIP models, though a similar experiment without humans has not been assessed as part of FireMIP yet. Without humans, fire’s impact on savanna is 0.8–10.8% (Table 1). Although less than other stressors, it has a substantial effect, highlighting the importance of including human factors in fire and vegetation modelling.
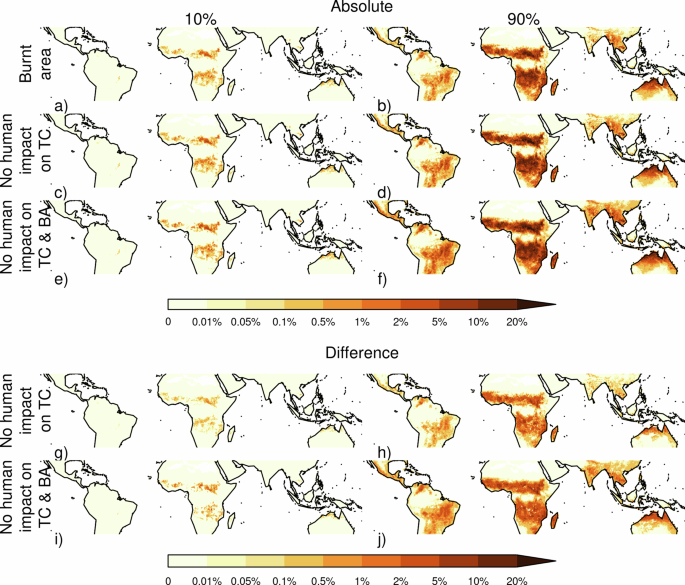
a, b Fire as per Fig. 2, c, d fire without direct human influence on tree cover and e, f fire without influence from human impact on tree cover or burnt area. g, h Shows the added impact on tree cover fire would have without humans influencing tree cover, while i, j shows fires added impact without human influence on tree cover or burnt area. Columns show 10% and 90% percentiles accounting for framework uncertainty.
Fire impact on tree cover in areas with high burned area is more substantial, comparable to cropland and pasture (Fig. 6). It reduces tree cover by 0.2–0.6 per unit burnt area at burnt areas >60%, compared to 0.7–1.0 per unit cropland area and 0.4–0.6 per unit pasture area (Fig. 7). However, annual burning covers a smaller area than land use – 3.8–5.7% of the tropics (depending on the dataset used, Supplementary Fig. 6). There is considerable uncertainty in the impact when burnt area is low, with tree cover reduction up to 10 times the annual average burning in areas with little fire. This suggests that, in regions with small burnt areas, the introduction of fire may still substantially impact tree cover. As burnt areas increase, their impact on tree cover is roughly linear. In contrast, the impact of heat stress increases sharply at temperatures above 35 °C and rises with wind up to 4 m/s with the possibility of much larger impacts for windspeeds >10 m/s. Relative tree cover impacts increase exponentially with rainfall seasonality, linearly to urban and cropland areas, and plateaus when pasture area cover is 20%.
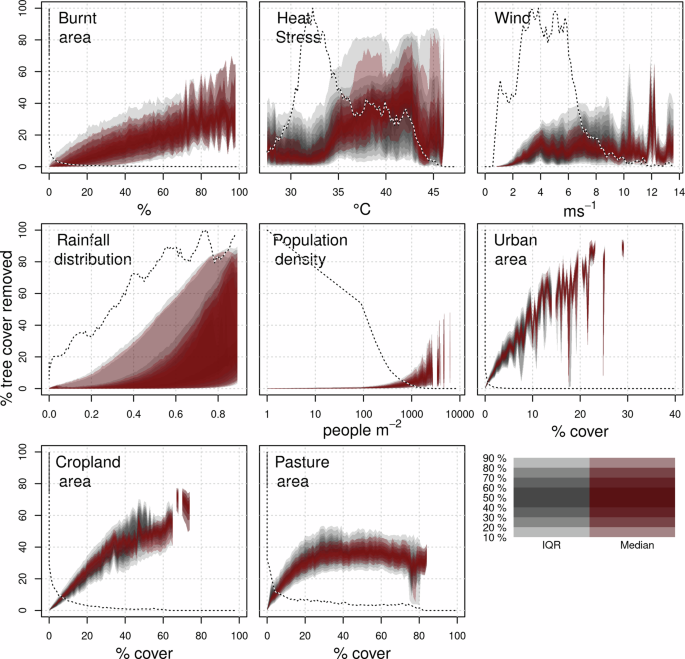
calculated as the difference in tree cover with and without each stressors divided by tree cover without that control (Eq. (8), methods). Grey areas represent the 10–90% uncertainty percentiles (in 10% increments) of the response interquartile range. Red areas represent the 10–90% percentiles (in 10% increments) of median response. The dotted lines show the frequency of occurrence of controls.
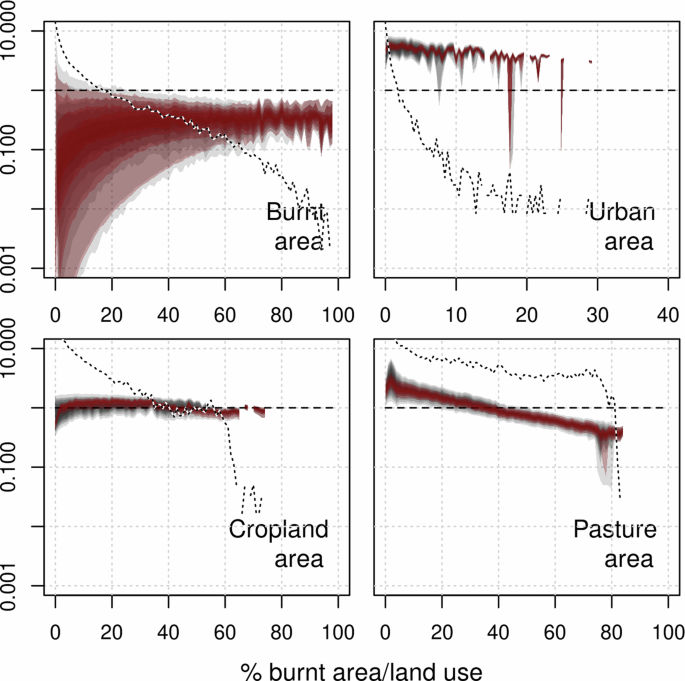
Calculated as \((T{C}_{* }\left(i\right)-{TC})/({A}_{{bin}}\times T{C}_{* }\left(i\right))\) where \({A}_{{bin}}\) is the burnt/land-use area of each bin and TC*(i) is tree cover without burnt area/land use (i.e. a value of 1 indicates a 100% tree cover exclusion from the burnt/land-use area). Dotted lines show the frequency of occurrence of burnt area/ land use.
Fire has little effect on tree cover bimodality (Fig. 9). No variable contributes solely to the intermediate tree gap identified in refs. 17,44 though removing the impact of heat stress or rainfall seasonality splits the gap to lower and higher tree covers (i.e. from between 33% and 98% to between
Sensitivity of tree cover to disturbance
Tree cover in most savanna, grass and desert areas of the tropics is insensitive to small changes in any controls, i.e., for trees to establish, they require a considerable reduction in the limitation imposed by both MAP and other stresses. (Figs. 1 and 2). However, in seasonal semi-arid areas, which are susceptible to shifts in stress45 and where rainfall seasonality and heat stress have the greatest impact (Fig. 2), marginal changes in rainfall patterns and temperature could have a major impact on tree cover (Figs. 1 and 7). South American forests and savannas are most sensitive to changes in land use, suggesting agricultural practices could have the largest impact on future tree cover in these regions. Rainforests across the Amazon, Congo, Borneo, New Guinea Southern lowlands and Yunnan/Guizhou evergreen and dry deciduous forests are also sensitive to land use impacts. Additionally, Amazon and Indonesian rainforests show vulnerability to stress in key deforestation areas (Fig. 2).
Marginal changes in burnt area have minimal impact on savanna tree cover. Still, they could substantially impact tree cover in forest areas (Fig. 8). A 1% increase in burnt area could decrease tree cover by as much as 2% (at the model distributions 90th percentile) in the southern and eastern Amazon basin, the Amazonia arc of deforestation and South America’s Atlantic forests. Smaller but important regions of sensitivity to burning also include Gabon and the western Congo forests (1.5–2% tree cover reduction with a 1% burnt area increase), southern Indonesia (1–2% reduction), the south of China moist forests (up to 2% reduction) and the eastern India dry forests (1–1.5% reduction). However, there is considerable uncertainty in this sensitivity to fire, and our framework suggests that little to no change in tree cover is also possible (Fig. 8).
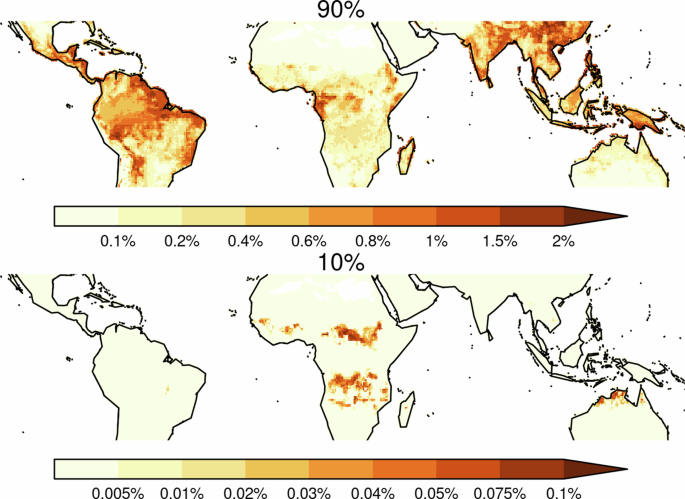
Reduction in tree cover due to a 1% increase in burnt area for (top) 90% and (bottom) 10% uncertainty range. Note that the colour scales of the two maps differ.
Implications and uncertainties
Aside from MAP (mean annual precipitation), we show that rainfall seasonality and land use are likely dominant factors in maintaining tree cover at current levels. Beyond these, co-limitation from different controls (Figs. 1 and 2) suggests that no single factor influences savanna tree cover, noting that soil texture and fertility, not included here, could also determine the location of forest-savanna transitions20 with variations at finer resolutions than tested here. All variables have a negligible effect on the bimodality of the reconstructed tree cover (Fig. 9) and are unlikely to be a cause of the “missing” intermediate tree covers at the resolution we test. Alternative drivers for missing intermediate tree cover include the natural distribution of cover expected under random fluctuations46 and biases in tree cover observations, which tend to underestimate tree cover in savannas21,24. Our results suggest that either of these or factors not included, such as soils, are more likely drivers of tree cover bimodal distribution. As relevant soil properties vary at a finer resolution than there are detailed tropical observations, we did not test soil here. However, future work in specific locations and finer scales could incorporate soil properties.
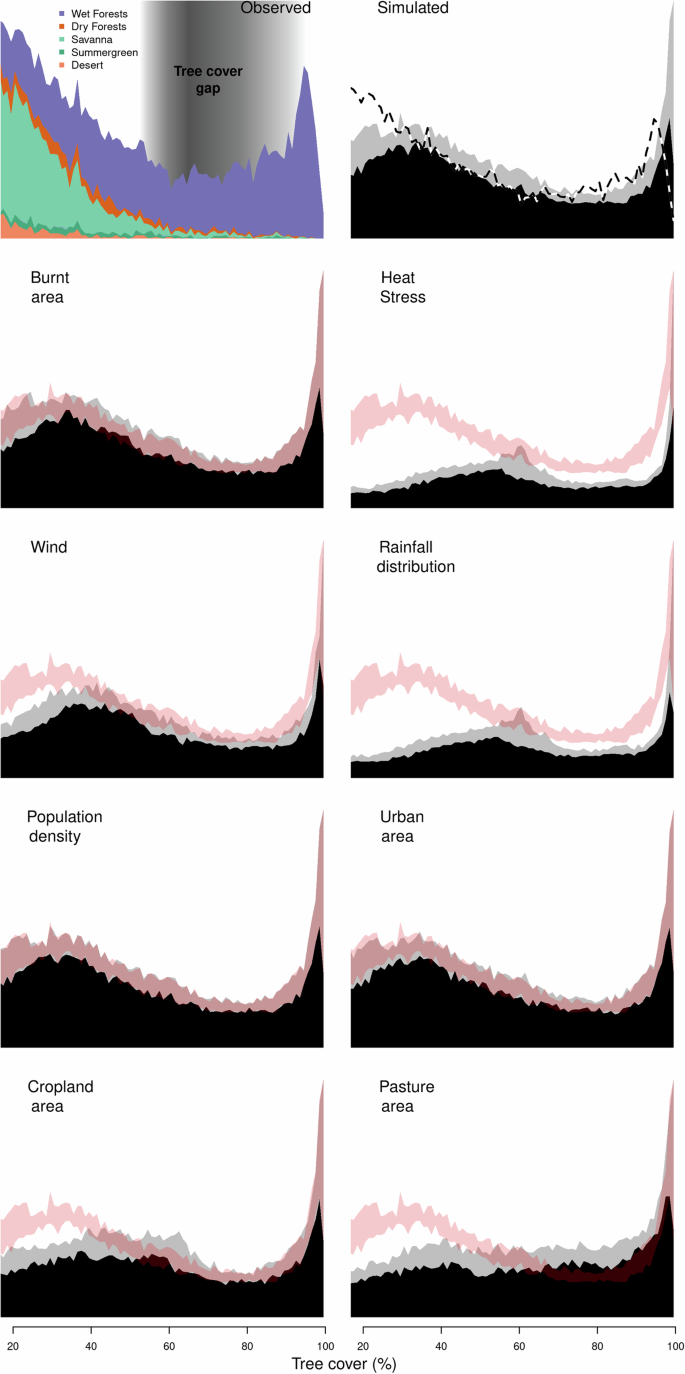
Top left for VCF observations, with colour indicating the frequency of occurrence by aggregated Olson biomes84 (see methods). Top right for the framework with black showing 10% and grey showing 90% percentile based on parameter uncertainty and dashed line the VCF observations. This corresponds to red-shaded regions’ in subsequent plots, which show tree covers from the framework when each listed environmental stress or human pressure control is removed.
The impact of land use on tree cover does not always match the extent of the tree cover itself. This is because, in addition to the extent of land use changes, reductions in tree cover may diverge due to various factors, including spatial heterogeneity, differential sensitivity of vegetation types, ecological resilience and regeneration processes, fragmentation effects, management practices, and climate and environmental factors. While some of these impacts extended beyond the land cover extent itself, we safely assumed that they occur within the same gridcell, given the coarse scale of analysis (0.5°, ~50 km) employed in this study. That tree cover responses follow cropland extent (Fig. 6) suggests that any additional impact on tree cover beyond cropland extent are negligible on our coarse scales. Urban areas do have a large impact beyond their extent – up to 10 times at lower urban covers, possibly owing to factors such as heat island effects, altered microclimates, fragmentation of surrounding ecosystems, and direct human disturbances such as deforestation and land clearing for urban expansion. Pasture, however, shows a smaller impact than pastures own extent, especially as pasture area increases, indicating high tree cover retention at higher pasture areas.
Heat stress and windthrow have a substantial impact on tree cover which is in line with47,48. Few DGVMs incorporate direct effects of either (though note8), which our results suggest might also aid simulated vegetation distribution. For example, heat stress affects the productivity of vegetation. It can have large implications for the resilience of tropical forests towards the more severe climate projections into the twenty-first century49. While DGVMs represent declines in productivity at higher temperatures (and lower precipitation), some mortality mechanisms, such as xylem embolism during extreme heat and drought50, may be underrepresented in models51. Also biotic attacks following drought and/or windthrow events52 are generally not represented in models.
Fire has a surprisingly low influence on tropics-wide tree cover, though it plays a more important role in savannas, suppressing tree cover by 0.6–7.1%. Without human impact on burnt area and tree cover loss, the impact on fire in savannas has the potential to be much higher at between 0.8 and 10.8% (Table 1). This is more in line with empirical studies and field experiments13,53 though it still shows that the independent impact of fire is not enough to fully explain the lack of tree cover within savannas. The use of remotely sensed data may contribute to the surprisingly low impact. Overstory mortality is generally minimal in frequently burned woodlands and savannas, with frequent surface fires primarily influencing recruitment through high seedling/sapling mortality. Therefore, the observed low impact of burnt areas from surface fires on tree cover, as detected by satellites, may reflect the resilience of mature trees to fire-driven mortality in these environments. However, it is worth noting that FDGVMs tend to target remote sensed burnt area for parameterisation and evaluation11,32,54.
We were able to separate out the effects of different co-varying impacts – which is challenging in many field-based and empirical studies that often consider fire in isolation from other dry disturbances13. These findings are not inconsistent with the idea that fire has an important impact on vegetation cover and species selection but suggest that tree covers are mostly at equilibrium in fiery landscapes with present-day fire regimes.
By considering the controls on the static distribution of tree cover, the study does not look at the sensitivity of factors that may determine forest cover temporarily. In deforestation hotspots, increased deforestation rates are associated with increased burning30, which can then decrease due to subsequent land fragmentation35 – a process not inconsistent with but not tested in this study. Large-scale tropical deforestation also leads to warmer, drier and more seasonal conditions55,56 that our results suggest may maintain low tree cover. Fire may also play a role in future forest transitions, resulting from interactions between land use change, fire and land-atmosphere exchange in a changing climate.
The slight reduction in tree cover could be because of coarse (0.5° × 0.5°) spatial scale. Other studies show a substantial impact (up to 20%13) of fire on tree cover at fire return intervals of around 1–10 years, which would result in coarse-scale burnt areas of (1/return time) 10–100% burnt area53. Here, we show tree cover is reduced only slightly less than the annual average area burnt – consistent with these finer-scale studies and on par with the impact of agricultural land use per unit area (Fig. 7). Therefore, our results do not preclude a substantial impact of fire on cover if the same areas within a given grid cell are burning each year, which would also explain tree cover changes found in fire exclusion experiments57. In mesic tropical systems (savanna and dry forest), fire effects on tree cover can be substantial if vegetation experiences frequent fires, particularly later in the dry season19. These regions show a higher impact (Table 1; Fig. 4). However, burning here still only impacts relative tree cover by up to 20%, with many areas seeing little impact. Tree species in ecosystems prone to regular fires demonstrate adaptations that allow them to survive, resprout and recruit in the presence of burning58,59. These effects could be tested by representing subgrid heterogeneity or applying this framework at finer resolutions. From an Earth System perspective, fire and the other stressors tested do not just impact vegetation distribution. There are also disturbance-driven variations in other important wood vegetation processes such as height, carbon uptake, carbon allocation, hydrology, and ecosystem fluxes6,60,61, all of which are influenced by fire.
Fire impact on tree cover is less than previously found in DGVM studies6. Many fire-enabled DGVMs incorporate the impact of precipitation through carbon dynamics, which determines vegetation distribution to some extent. However, most models also require a substantial impact from fire to simulate the correct distribution of tree cover. As fire impacts co-vary with other stress factors, most notably seasonal rainfall distribution (Supplementary Fig. 7, Supplementary Fig. 8), DGVMs might overly rely on fire to simulate correct tree cover distribution because they underestimate vegetation response to moisture availability. Some FDGVMs use fire intensity to describe fire impacts on cover11,54, and incorporating intensity into this framework may help constrain the broad uncertainty in fire impact – particularly in regions with low burnt areas and high tree covers (Fig. 7). However, despite the wide distribution of potential fire impacts, even the most extreme of our framework’s posterior probability distribution suggests that fire reduces tropical tree cover significantly less than any tested FDGVM. This assumes that switching off fire from our present-day fire-on state would result in vegetation cover equal to the fire-off simulation. Both simulations have been spun up with and without fire, respectively, which may lead to different stable states in the present day. More targeted fire model experiments (e.g. switching off fire at the present day and running to equilibrium) are needed to provide a more specific test. Adapting our framework to test the transient impacts of fire on cover (from, e.g. deforestation fires) will also help attribute the differing impact fire can have on tree cover over time.
We took advantage of the work in FireMIP to compare how fire modulates tree cover to our observational constraints. Other model intercomparisons could perform similar factorial experiments to compare to our results. The constraints we have found on the impact of wind and heat stress could be particularly useful to assess and re-parameterise vegetation models that represent both these disturbances. This might also establish if the larger impact of fire is due to little impact of climate seasonal rainfall, windthrow or heat stress. Like DGVMs, our model considers similar responses of tree cover across continents with different evolutionary histories and across gradients of anthropogenic landscape modification. Further framework development could attribute uncertainties in tree cover disturbance responses to these assumptions, which may also help guide DGVM development priorities.
Our framework shows considerable uncertainty in the impact of fire in humid forests, which, historically, have not experienced regular burning. Our framework suggests a plausible range from virtually no sensitivity of forests to burning up to more than twice as much forest loss as changes in burnt area. However, as these areas have not historically experienced high fire occurrence, their vegetation is unlikely to be fire-adapted. And many studies have highlighted tropical forest areas that experience infrequent burning as particularly sensitive to even small increases in burning62,63,64. We have not considered the distribution of fire resilience or acclimation to fire in this study. There has been a considerable shift in burnt area controls found in many of the pantropical forest areas29, and a recent UN report highlighted Eastern and Southern Amazon and Indonesia as at risk for substantial increases in wildfire occurrence35. In these regions, tree cover could still be significantly affected by fire under future environmental change, particularly if the speed of such a change precludes the establishment of more adapted tree communities typical of more fire-prone wooded ecosystems65,66,67,68.