The Zhangcun Coal Mine is located in Changzhi City, Shanxi Province, and mainly mines the No.3 coal seam, which possesses an average thickness of 5.69 m. The burial depth of the mining operation is 500–517 m, and it utilizes a fully automated top coal caving mining technique. The immediate roof of the roadway consists of mudstone with an average thickness of 2.62 m; The basic roof of the roadway is composed of sandstone with an average thickness of 9.22 m; The immediate floor of the roadway is made up of mudstone with an average thickness of 3.46 m; The basic floor of the roadway comprises fine-grained sandstone with an average thickness of 5.67 m, as shown in Fig. 1(a). The 480-material roadway refers to the + 480 m mining level development roadway that is excavated along the roof within the coal seam. This roadway is constructed with a rectangular section, measuring 5.6 m in length and 3.7 m in height. The 480-material roadway and 480-belt roadway are arranged parallel, with a separation distance of 55 m. In front of the 480-material roadway, there is a collapse column labeled as X20, which intersects with section III of the 480-material roadway, as shown in Fig. 1(b). Notably, no water discharge is observed from the drill hole during the identification process of the collapse column, indicating an absence of potential water conduction within the collapse column. The presence of a collapse column has a detrimental impact on the stability of the surrounding rock and is not conducive to support for the roadway. In the collapsed column area, this study employed a core drilling method to ensure the integrity of the obtained rock samples. Given the relatively soft texture of the rock samples in the collapsed column fractured zone, the drilling speed was reduced to minimize damage to the samples during the extraction process. Subsequently, to prepare standard-compliant specimens for subsequent strength testing, the YSXQ-II diamond wire CNC cutting machine was used for precise cutting of the rock samples.
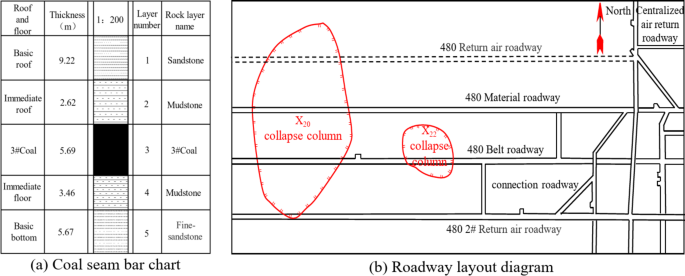
Geological conditions of 480-material roadway.
Modeling process and methods
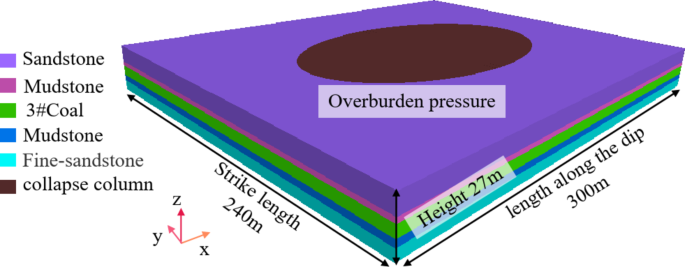
The engineering background for this study was the 480-material roadway in Zhangcun coal mine. A three-dimensional geometric model was constructed, with dimensions of 300 m (length) × 240 m (width) × 27 m (height), as shown in Fig. 2. The collapse column is situated directly in front of the roadway, and the length of the study roadway is 240 m. The roadway is divided into two sections based on the surrounding rock characteristics. The first section, ranging from 0 to 55 m and 185–240 m, is classified as normal surrounding rock. The second section, from 55 to 185 m, is categorized as the geological abnormality zone associated with the collapse column. The lower boundary of the model was set as a fixed constraint, while normal displacement constraints were applied to the surrounding boundaries. Additionally, the upper boundary was set as the gravity load of the overlying rock.
The fractures in the collapse column conform to a random distribution, and the Monte-Carlo method is employed to implement the fracture stochastic simulation process. The features of the Discrete Fracture Network (DFN) were characterized using the FLAC3D software, which involved determining the size, location, and orientation of the fractures. It is assumed that the distribution of fracture sizes follows a negative power-law distribution30.
$$n(l)=\alpha {l^{ – a}}$$
(1)
Where n (l) represents the length of the fracture size, m; α represents the density term; a represents the power function index, which takes the value of 3 to 4, employed to control the ratio between large and small-sized fracture. As the “a” increases, so does the size of the fracture.
Integrate Eq. (1) to obtain the maximum and minimum dimensions of the fissure:
$$\left\{ \begin{gathered} N\left[ {{L_{\hbox{min} ,}}{L_{\hbox{max} }}} \right]=\frac{\alpha }{{1 – \alpha }}(L_{{\hbox{max} }}^{{1 – a}} – L_{{\hbox{min} }}^{{1 – a}}) \hfill \\ F=\frac{{N\left[ {{L_{\hbox{min} ,}}L} \right]}}{{N\left[ {{L_{\hbox{min} ,}}{L_{\hbox{max} }}} \right]}}=\frac{{{L^{1 – a}} – L_{{\hbox{min} }}^{{1 – a}}}}{{L_{{\hbox{max} }}^{{1 – a}} – L_{{\hbox{min} }}^{{1 – a}}}} \hfill \\ \end{gathered} \right.$$
(2)
Where Lmin represents the minimum side length of the cube, m; Lmax represents the maximum side length of the cube, m.
The spatial position of the DFN fissure inside the collapse column conforms to the most widely used Poisson process. In this paper, it is assumed that the central point of the 3D fissure obeys the Poisson point process31. Each individual fissure is considered independent from others, and a random uniform distribution function is used to obtain the coordinates of the fissure centers (x, y, z).
Fracture azimuths are vectors, containing dip and inclination, and are assumed to follow the Fisher distribution32.
$$f(\theta ,\Phi )=f(\Phi )f(\theta )=\frac{1}{{2\pi }}\frac{{k\sin \theta }}{{2\sinh k}}{e^{\cos \theta }}$$
(3)
Where θ represents the fissure dip angle, °, 0 ≤ θ ≤ 90°; Φ represents the fissure dip direction, °, 0 ≤ Φ ≤ 360°; k represents the coefficient of discretization, and the larger the value of k is the more concentrated the data constraints are.
The fracture mass density reaches a threshold fracture generation termination33:
$${d_m}({l_c}) \cong \int_{{{l_c}}}^{\infty } {n(l) \cdot {l^2} \cdot {L^{ – 3}}}$$
(4)
Where: dm (lc) represents the cumulative fissure surface area per unit volume, m2/m3; l2 represents the fissure area, m2; L represents the dimension length, m.
The attribute parameters of DFN were set according to Eq. (1) to (4), whose parameter ranges cover the literature34,35,36 and are listed in Table 1.
This study establishes a Discrete Fracture Network (DFN) within a 55–185 m section of a 480-material roadway to simulate the impact of random fissures within the collapse column on the support system. The method of DFN construction entails establishing the size, location, and orientation, as illustrated in Fig. 3.
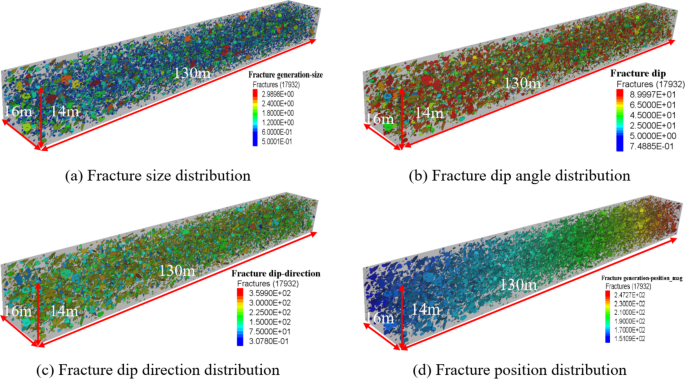
The internal fracture reconstruction process of collapse column.
The strength parameters in the crushed zone of the collapse column exhibited nonlinear variations, and the change in strength deterioration became more pronounced with the increase in stress. Therefore, a strain-softened constitutive model was employed to simulate the internal loosening characteristics of the collapse column. The strain softening constitutive model is based on an improved Moore-Coulomb constitutive model with uncorrelated shear and correlated tensorial flow rules. This principal structure accounts for the softening of the material cohesion, the angle of internal friction, and the tensile strength upon reaching the yield state.”
After the model material reaches the yield state, both elastic and plastic strains are generated, as shown in Fig. 4, at which time the strain is:
$$\varepsilon ={\varepsilon _e}+{\varepsilon _p}$$
(5)
Where ε represents the total strain; εe represents the elastic strain; εp represents the plastic strain.
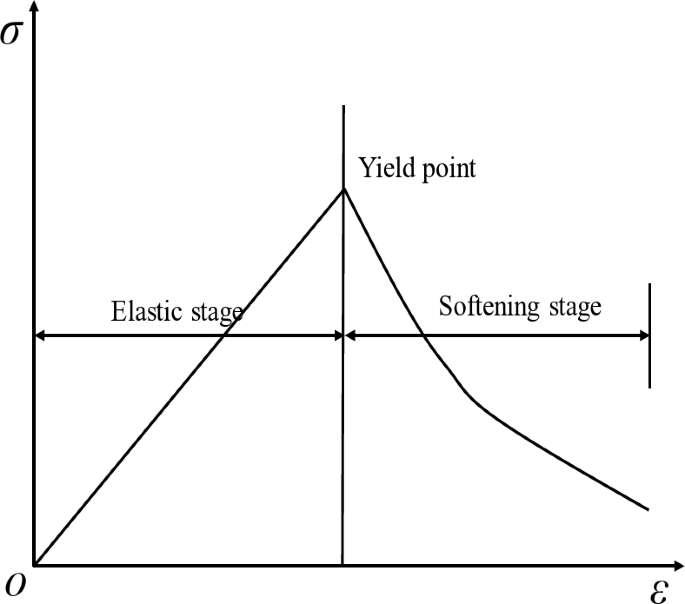
Stress-strain relationship.
The plastic shear strain in the yield failure of a collapse column as a function of cohesion, the angle of internal friction as an independent variable is defined as37:
$$\Delta {\varepsilon ^{ps}}=\frac{1}{{\sqrt 2 }}\sqrt {{{(\Delta \varepsilon _{1}^{{ps}} – \Delta \varepsilon _{m}^{{ps}})}^2}+{{(\Delta \varepsilon _{m}^{{ps}})}^2}+{{(\Delta \varepsilon _{3}^{{ps}} – \Delta \varepsilon _{m}^{{ps}})}^2}}$$
(6)
Where \(\Delta \varepsilon _{m}^{{ps}}=\frac{1}{3}(\Delta \varepsilon _{1}^{{ps}}+\Delta \varepsilon _{3}^{{ps}})\), \(\Delta \varepsilon _{j}^{{ps}}\), j = 1, 3 represents the plastic shear principal strain increment.
Plastic tensile strain is defined as a function independent variable of tensile strength:
$$\Delta {\varepsilon ^{pt}}=\left| {\Delta \varepsilon _{3}^{{pt}}} \right|$$
(7)
Where \(\Delta \varepsilon _{3}^{{pt}}\) represents the plastic strain increment in the direction of the principal stress.
The model material yield failure criterion is38:
$$\left\{ \begin{gathered} {f^s}={\sigma _1} – {\sigma _3}{N_\varphi }+2c\sqrt {{N_\varphi }} \hfill \\ {f^t}={\sigma _3} – {\sigma ^t} \hfill \\ \end{gathered} \right.$$
(8)
Where σ1 represents the maximum principal stress, MPa; σ3 represents the minimum principal stress, MPa; fs=0 represents the shear failure; ft=0 represents the tensile failure; c represents the cohesive force, MPa; φ represents the angle of internal friction, °; Nφ = 1 + sinφ/1-sinφ.
The FLAC3D software was used to simulate the uniaxial compression of the specimen within the crushed zone of the collapse column. This study aims to ascertain the softening behavior of cohesion, friction angle, and tensile strength in specimens located within the crushed zone of the collapse column. The simulation parameters were calibrated and depicted in Fig. 5. Softening functions for cohesion, friction angle, and tensile strength were determined and listed in Table 2.
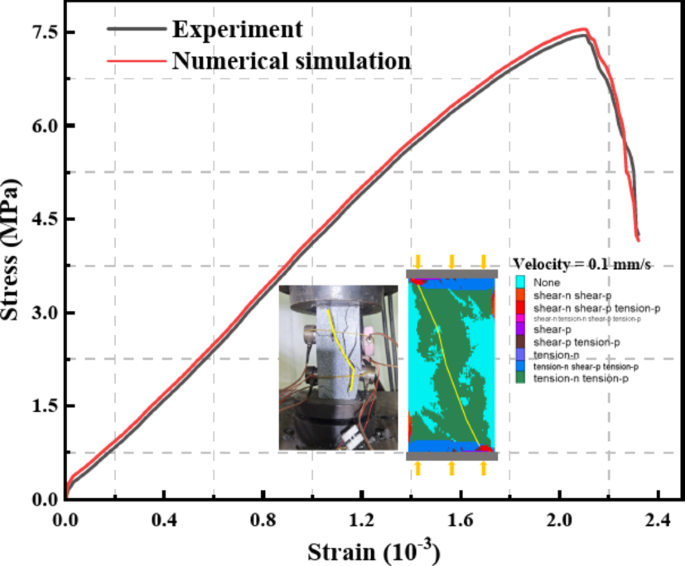
Calibration of numerical simulation parameters.
The Mohr-Coulomb constitutive model was employed to simulate the remaining formations. To approach the actual parameters in the field, the physical and mechanical parameters of each formation were strength discounting based on laboratory measurement data39,40, as listed in Table 3.
Analysis and discussion on the stress evolution law of surrounding rock
(1) Stress distribution pattern of the original rock.
The vertical stresses inside the collapse column, as depicted in Fig. 6, are comparatively lower than those observed at the peripheral boundaries of the collapse column. Notably, high stress levels are evident at the periphery of the collapse column. If the ultimate strength of the rock mass is exceeded, the peripheral boundary of the collapse column is prone to destabilization failure. The stress changes from the interior of the collapse column to the peripheral boundary, exhibiting a gradual decrease followed by an increase, creating a stress decrease zone and an increase zone. As the distance of the peripheral rock body from the boundary of the collapse column increases, the vertical stress gradually decreases and eventually reaches a stable state. The zoning of the collapse column consists of four distinct regions: I – the internal impact zone of the collapsed column, II- the stress-decreasing zone, III- the stress-increasing zone, and IV – the initial stress zone, in sequential sequence. The numerical simulation results presented in this paper are consistent with the pattern of numerical simulations in the references41.
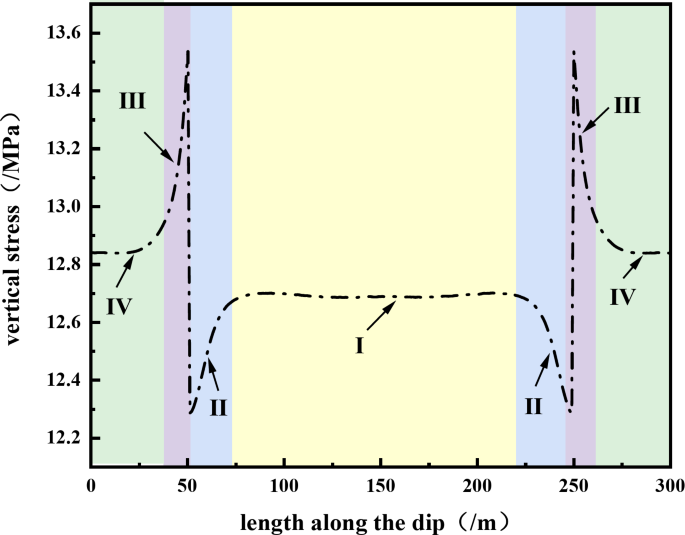
Distribution law of original rock stress.
(2) Analysis of the stress evolution law of the surrounding rock before exposing the collapse column.
Figure 7 illustrates the formation of an elliptical high-stress zone around the collapse column. During the roadway excavation, the stresses of the roof and the excavation working face are elevated and eventually coupled with the elliptical high-stress zone. If the ultimate strength of the collapse column is exceeded, the initial failure occurs at the top of the collapse column and the ring boundary. When the roadway was excavated for 30 m, the stress in front of the excavation working face increased from 17 MPa to 18 MPa, an increase of 6%. When the roadway was excavated for 50 m, the stress in front of the excavation working face suddenly increased to 20 MPa, an increase of 11.11%. At this time, the distance between the roadway and the collapse column is getting closer and closer, while the inside of the collapse column is loose. Consequently, the collapse column fails to provide support to the roof, resulting in an increased stress in front of the excavation working face.
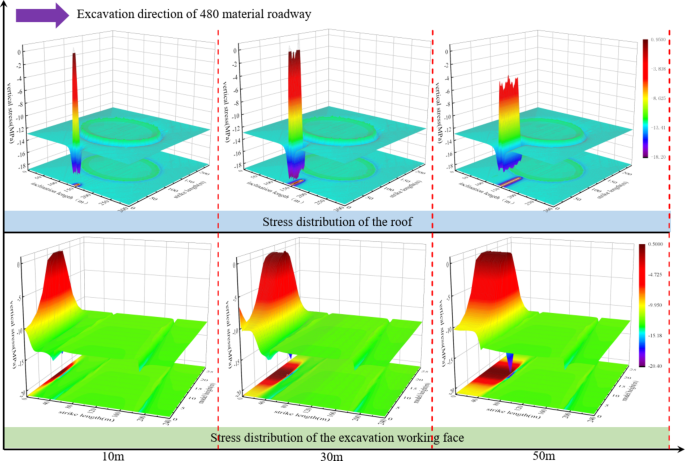
Vertical stress distribution in the surrounding rock before exposing the collapse column.
(2) Analysis of the stress evolution law of the surrounding rock during the exposure of collapse column.
Figure 8 demonstrates the superimposed coupling of the roof stress with the elliptical high-stress zone when the roadway was excavated for 60 m, and the stresses on both sides of the collapse column are strengthened. The stress in front of the excavation working face experienced a sudden reduction from 20 MPa to 14 MPa, representing a decrease of 30%. The interior of the collapse column is loose and does not support the roof of the roadway, resulting in significant failure and a decrease in stress. The excavation of the roadway extended for 120 m, and the collapse column was exposed for 70 m. The stress of the roof increased from 20 MPa to 22 MPa, an increase of 9%. Furthermore, there was a secondary increase in stress observed on both sides of the collapse column. The stress in front of the excavation working face increased from 14 MPa to 16 MPa, an increase of 14.3%. The minor failure range of the roof at this stage is attributed to the low stress in the center of the collapse column, and the stress concentration is enhanced. When the collapse column is exposed for 130 m, the stress in the roof increases from 22 MPa to 23 MPa, an increase of 4.54%. The stresses in front of the excavation working face were coupled with the elliptical high-stress area in a secondary superposition. The stress increased from 16 MPa to 17 MPa, an increase of 6.25%. In summary, when the roadway is close to the center of the collapse column, the stress in the center of the column is low, and less damage occurs to the surrounding rock. There is a significant increase in stress on the sides and front of the roof.
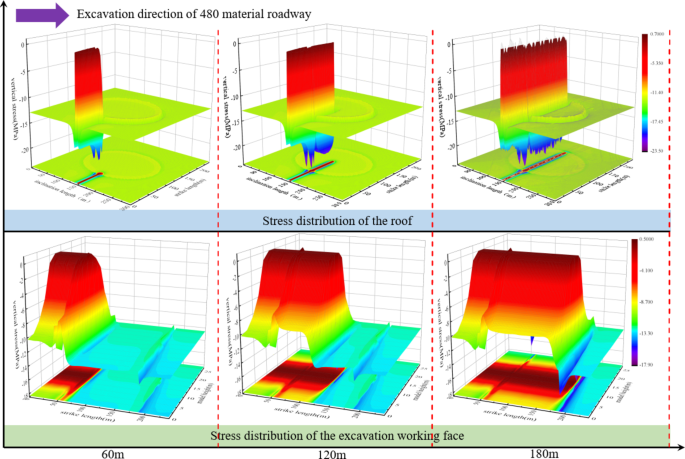
Vertical stress distribution of surrounding rock when exposing collapse column.
(3) Analysis of stress evolution law of surrounding rock after exposing collapse column.
Figure 9 demonstrates that when the roadway excavation is 190 m, the stress in the roof is coupled with the elliptical high-stress zone, which changes from 23 MPa to 24 MPa, an increase of 4.34%. The stress in front of the excavation working face increased from 17 MPa to 20 MPa, an increase of 17.6%. The stress on both sides of the collapse column was strengthened from 24 MPa to 26 MPa, an increase of 8.3%, when the roadway excavation was 220 m. At this time, the roadway entered the ordinary surrounding rock with the roof providing a certain degree of support. The stress of the roof is strengthened, which makes a secondary reinforcement for the stress on both sides of the collapse column. When the roadway excavation was 230 m, the stress of the roof did not change and remained at 26 MPa. The roadway leaves the influence zone of the collapse column, and the stress coupling phenomenon gradually dissipates. When the collapse column was exposed after 30 m ~ 50 m, the stress in front of the excavation working face was maintained at 17 MPa, which was reduced by 15%. In summary, when the roadway passes through the collapse column for 10 m, it remains within the influence zone of the collapse column. However, once the roadway passes 30 m ~ 50 m after the collapse column, it exits the influence range of the collapse column.
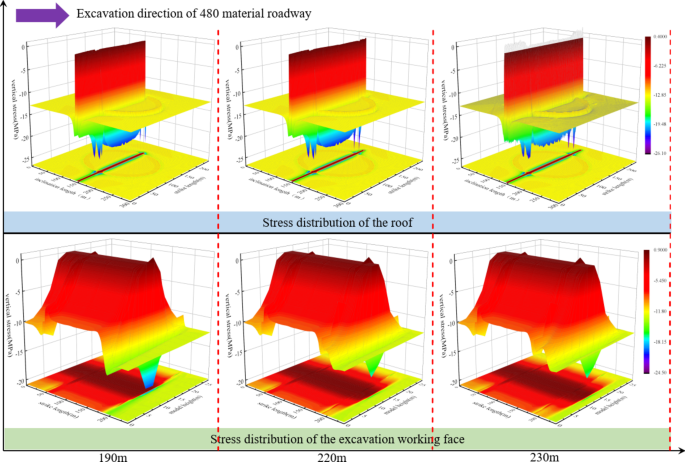
Vertical stress distribution of surrounding rock after the collapse column is exposed.
Analysis and discussion on the distribution pattern of plastic zone in surrounding rock
When the roadway excavation is 10 ~ 30 m, shear failure predominantly occurs in the surrounding rock, as shown in Fig. 10. Circumferentially distributed shear failure was produced around the ellipse of the collapse column, and extensive shear failure occurred at the top of the collapse column. When the roadway excavation reaches a depth of 50 m, the failure range of the roof extends to 2.4 m, while the failure range of the floor reaches 2.01 m, and the failure range of the right side is 1.9 m. A small amount of shear-tension failure occurs at the top and periphery of the collapse column. The closer the roadway is to the trapped column, the greater the impact of mining stresses, leading to shear-tension failure at both the upper and periphery of the collapse column. when the collapse column is exposed, the mining-induced stress and the internal loosening lead to much shear failure and a minor tensile failure at the top of the collapse column.
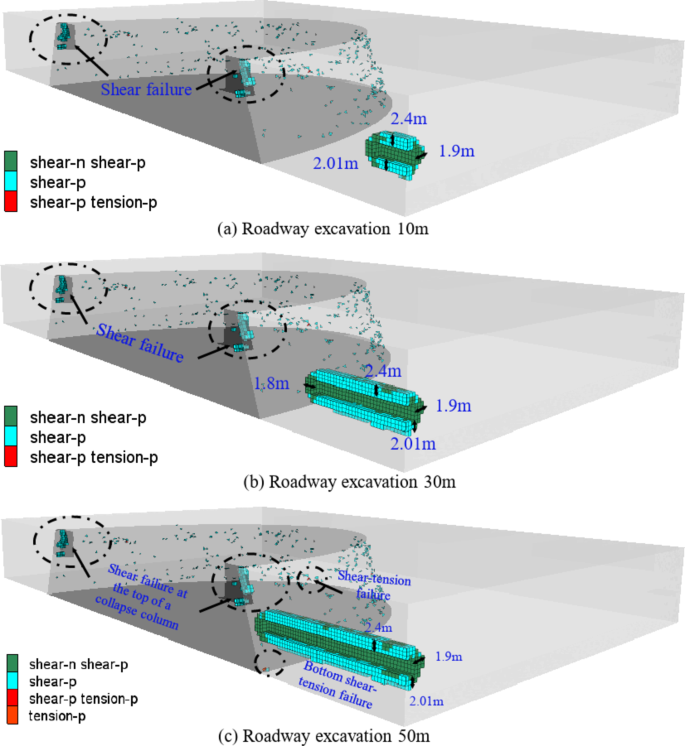
Failure law of surrounding rock when collapse column is not exposed.
Figure 11 illustrates the failure distribution to the surrounding rock when the collapse column is revealed. When the collapse column was exposed for 10 m, a large amount of shear failure occurred at the periphery of the collapse column. The damage range of the roof reaches 6.96 m, and the failure of the floor reaches 7.32 m. A large amount of failure occurs at the interface between the collapse column and the coal seam. When the collapse column is exposed for 70 m, the failure range of the roof reaches 4.57 m, which is reduced by 34.3%, and the failure range of the floor reaches 4.3 m, which is reduced by 41.2%. In summary, the tectonic zone at the periphery of the collapse column leads to stress concentrations. A large amount of failure occurred in the peripheral tectonic zone of the failure column under the disturbance of mining stresses. When the roadway passes a collapse column, tensile failure occurs in the shallow surrounding rock, while shear failure takes in the deeper surrounding rock. Overrun pre-grouting is required to enhance the strength of the surrounding rock.
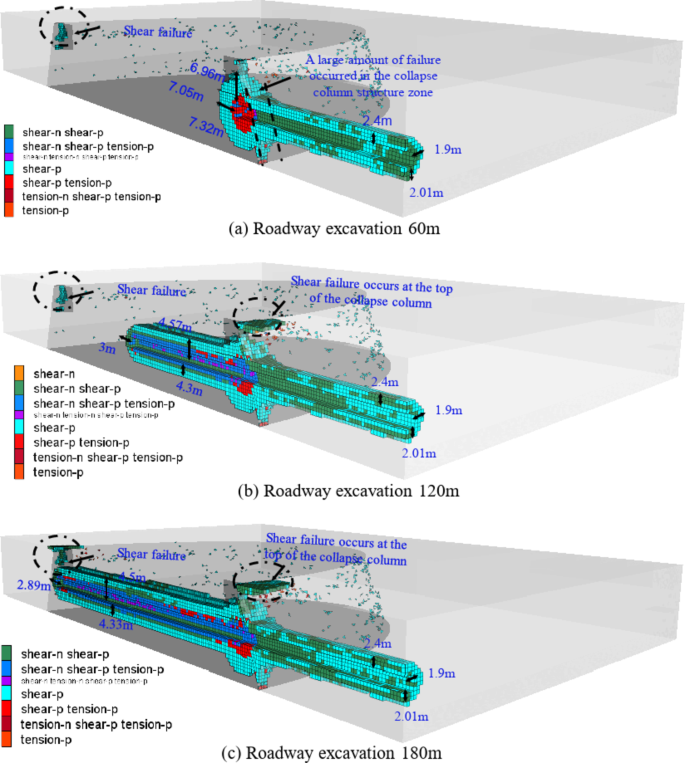
Failure law of surrounding rock when exposing collapse column.
Figure 12 illustrates the failure law of surrounding rock after the collapse column is exposed. After the roadway traversed the collapse column for 10 m, a large amount of shear failure occurred at the junction between the collapse column and the coal seam, as shown in Fig. 12(a). The roadway is currently affected by the collapsed column. After the roadway passes through the collapse column for 30 m~ 0 m, there is a decrease in the failure range of the surrounding rock, with shear failure becoming predominant. The failure range of the roof reaches 1.79 m, and the failure range of the floor reaches 1.9 m, as shown in Fig. 12(b) and (c). The current state of failure in the surrounding rock remains stable and is not progressing further in depth. In summary, The closer the roadway is to the collapse column boundary, the more significant the impact on the collapse column tectonic zone. Shear failure mainly occurs in the surrounding rock prior to the exposure of collapse column, and tensile failure mainly occurs in the surrounding rock during the exposure of the collapse column. Within the collapse column and within a 10 m range outside of it, the plastic zone of the surrounding rock experiences shear-tensile failure. Enhanced support is recommended for this area of the surrounding rock.
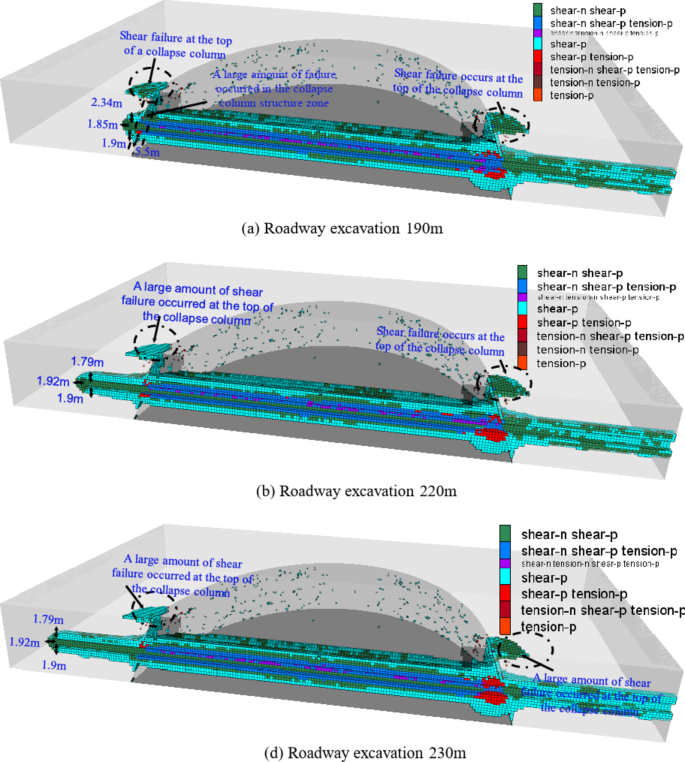
Failure law of surrounding rock after the collapse column is exposed.