The study cohort included both healthy controls (HC; n = 24), patients with PD (n = 28), and individuals diagnosed with isolated RBD (iRBD; n = 3) as presented in Table 5. PD patients were included due to their high RBD prevalence. Specifically, in this study, 54% of PD patients were diagnosed with RBD. Participants underwent one night of sleep assessment in a clinical sleep laboratory while using both PSG and the wearable system. They were also asked to use the wearable system for an additional night at home.
Participants
Healthy participants were included if they were between 40 and 80 years old and had no diagnosed neurological or psychiatric disorders (according to DSM-IV). Patients with PD were included if they were diagnosed based on the MDS criteria42, in Hoehn and Yahr stage I-III43 with no additional neurological or psychiatric disorders. RBD was diagnosed by a sleep-specialized neurologist based on full PSG. None of the participants were using psychiatric or sleep medication at the time of assessment. The study was approved by the Institutional Ethics Committee Review Board at Tel Aviv Sourasky Medical Center (TASMC) in accordance with the Helsinki guidelines and regulations for human research. All participants signed an informed written consent before participation. Demographic data included age, gender, disease duration, Hoehn and Yahr stage, and Apnea-Hypopnea Index (AHI).
Procedures
All participants were invited to a full night video PSG (vPSG) test. Male participants were asked to shave before arrival. Participants were fitted with the wearable system in conjunction with the vPSG system. At the beginning of each session, a calibration stage with both systems was conducted according to the AASM manual1. For home experiments, data were collected only with the wearable system, which was operated by a trained technician. The system was detached manually by the user in the morning and the recording unit was returned. The data was uploaded to a cloud server for further analysis.
Wearable system
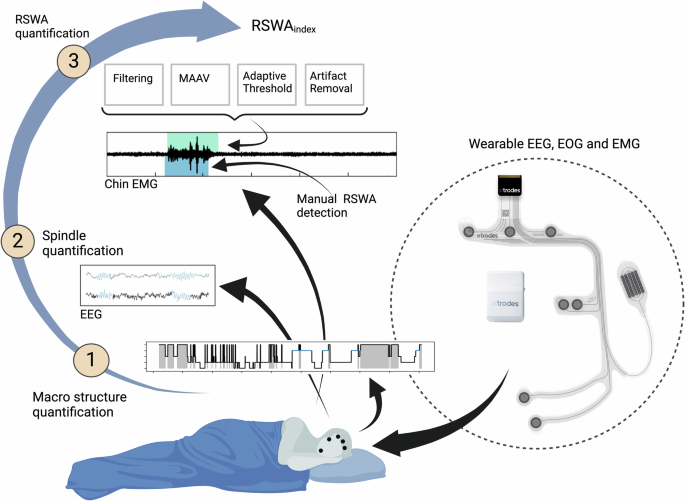
The electrode arrays have been previously described7,25,44,45. Briefly, carbon electrodes and silver traces are screen-printed on a thin, flexible film. A second double-sided adhesive film is utilized to adhere the electrode array to the skin and to insulate the silver traces. The electrode arrays incorporate three (four in an older version25) EEG electrodes (positioned on the forehead), two EOG electrodes (on the right side of the eye), and two EMG electrodes located on the chin mentalis muscle. A miniature proprietary data acquisition unit (DAU, by X-trodes Ltd.; dimensions: 42 × 42 x 14.8 mm, weight: 20 gr) is mounted on the head using a headband. The DAU supports unipolar channels (2 μV noise RMS, for the 0.5 and 700 Hz frequency range) with a sampling rate of 4000 S/s, 16-bit resolution, and an input range of ± 12.5 mV. A 620 mAh battery supports DAU operation for a duration of up to 16 hr. Continuous data transfer facilitated through Bluetooth (BT) module. An Android application enables the operator to define session settings, perform calibration, and observe the data in real-time. The data is stored on a built-in SD card and later transferred to the cloud for offline analysis. An internal (or gel in early experiments; Natus) ground electrode was placed on the right mastoid region. Previous report7 demonstrated the ability of the wearable system to collect data suitable for manual sleep scoring. The DAU and the electrode array are shown in Fig. 1.
Video Polysomnography (vPSG)
vPSG data were collected at the Institute for Sleep Medicine at TASMC. The vPSG tests were conducted with the Natus (NDx) system using the RemLogic software (Version 4.0.1, Embla) and standard electrodes placement (gold cup, Natus); six EEG electrodes (C3, C4, F3, F4, O1, O2), two EOG (left and right), three EMG electrodes located in the submental area (Chin1,chin2, ChinZ), and both anterior tibialis and flexor digitorum superficialis muscles (250 S/s). In addition, oronasal airflow, and a microphone were used. Thoracic and abdominal respiratory effort, position sensor, oxygen saturation, and electrocardiogram (ECG) were collected.
Data pre-processing
PSG and wearable system data were pre-processed using RemLogic software (Version 4.0.1, Embla) and Python (version 3.9), respectively. Both PSG and the wearable system data were filtered following AASM guidelines1: EEG and EOG signals were filtered using a 4th-order Butterworth bandpass filter with a frequency cutoff of 0.3-35 Hz. EMG signals were filtered using a 4th-order Butterworth bandpass filter with a frequency cutoff of 10−100 Hz. All signals were additionally filtered with a notch filter with a center frequency of 50 Hz and a Q factor of 20. For the PSG data, the following differential channels were defined: F4-M1, F3-M2, C4-M1, C3-M2, O1-M2, O2-M1, E2-M2, E1-M2, Chin1-Chinz, Chin2-Chinz. All channels of the wearable system were measured against its ground electrode (M2). Lights off and lights on times were defined manually by a sleep technician and the wearable system signals were confirmed respectively. Home test time boundaries were set according to subjects’ reports. Data were exported as European Data Format (EDF) files.
Sleep scoring
Sleep stages for both PSG and the wearable system recordings were classified manually by sleep specialists certified by the European Sleep Research Society. Analysis was performed using RemLogic software (Version 4.0.1, Embla) and Alice Sleepware software (version 2.7.43, Respironics), respectively.
Sleep macrostructure parameters
Various sleep macrostructures were extracted. In particular, we examined sleep efficiency, WASO, REM, and N3 proportions, owing to their widespread use. Values were calculated as follows based on manual sleep scoring:
$$\,{\rm{Sleep}}\, {\rm{Efficiency}}( \% )=\frac{{{\rm{Total}}\, {\rm{sleep}}\, {\rm{time}}}}{{{\rm{Total}}\, {\rm{time}}\, {\rm{in}}\, {\rm{bed}}}\,}* 100$$
(1)
$$\,{\rm{REM}}( \% )=\frac{{\rm{Time}}\, {\rm{in}}\, {\rm{REM}}}{{\rm{Total}}\, {\rm{sleep}}\, {\rm{time}}\,}* 100$$
(2)
$$\,{\rm{N}}3( \% )=\frac{{{\rm{Time}}\, {\rm{in}}\, {\rm{N}}3}}{{{\rm{Total}}\, {\rm{sleep}}\, {\rm{time}}}\,}* 100$$
(3)
$$\begin{array}{ll}{\rm{WASO}}\,(\min )={\rm{Number}}\, {\rm{of}}\, {\rm{minutes}}\, {\rm{in}} \,{\rm{which}}\, {\rm{a}}\, {\rm{person}}\, {\rm{is}}\, {\rm{awake}}\, {\rm{starting}}\\ {\rm{from}}\, {\rm{sleep}}\, {{\rm{onset}}\ast} \,{\rm{until}}\, {\rm{lights}}\, {\rm{off}}.\end{array}$$
(4)
*Sleep onset is defined as the start of the first epoch scored as any stage other than stage W.
Finally, the effects of sex, age, and AHI on sleep macro-structures were examined using paired t-test and Person correlation.
Automated spindle detection
Sleep spindles were automatically detected from both PSG and wearable data, using the YASA algorithm46, an open-source adaption of the A7 algorithm18 which was validated against human scoring, with performances equivalent to a human expert. YASA uses 3 different thresholds (relative sigma power, root mean square, and correlation). The A7 algorithm uses four thresholds (absolute and relative power, covariance, and correlation). The YASA algorithm determines the spindle start and end points by locating the onset of characteristic spindle activity, e.g., finding where two out of the three thresholds were crossed. EEG channels were down-sampled to 250 Hz and filtered according to the AASM guidelines1. Spindles were detected using YASA during the non-REM N2 stage as scored manually earlier. Spindles parameter definitions included a frequency band of 11−16 Hz, duration of 0.5−2 s1, and minimum distance of 0.5 s between two separate spindles. Spindles were detected in all EEG channels simultaneously. Spindles captured from different channels were considered the same if their start/end time fell within the same second. Detected sleep spindles with amplitude less than 20 uV or more than 80uV were excluded from the analysis. For each spindle detection, the median frequency derived from a Hilbert transform of the band-pass 1−30 Hz filtered signal was calculated. Spindle density was calculated as the number of spindles detected divided by N2 stage duration (min). The results were compared between PSG and wearable to establish the validity of the YASA algorithm to detect sleep spindles captured by the wearable system in both HC and PD/RBD, and between home and lab to explore lab-to-home variability. The effects of sex, age, and AHI on sleep spindles were examined using paired t-test and Pearson’s correlation.
Manual RSWA quantification
RSWA for both vPSG and wearable system recordings was quantified by sleep specialists certified by the European Sleep Research Society. Manual scoring of RSWA was performed according to the AASM1 and SINBAR47 criteria, by identifying “any” (i.e. phasic and/or tonic) muscular activity in the chin channel. RSWA index (RSWAi) was quantified using the ratio of REM sleep duration with “any” chin muscular activity to total REM sleep duration.
Automatic RSWA quantification
Chin EMG data from a subgroup of 18 subjects (HC=9; PD non-RBD=3; PD RBD=5; and iRBD=1) were used for the development and validation of the RSWA quantification algorithm. We compared RSWA prevalence identified by manual scoring of vPSG data to that of wearable data, as well as to the automatically quantified RSWA prevalence. RSWA was automatically detected from both PSG and wearable data. First, Chin EMG channels were down-sampled to 500 Hz and filtered using a 4th-order Butterworth high-pass filter with a cutoff frequency of 30 Hz, and a 4th-order notch filter (Q factor=30) centered at 50 Hz to reduce power-line interference. Manual sleep scoring was utilized to identify REM periods, with the analysis focused solely on these specific times. The algorithm includes two main steps and was conducted for each 30 s REM epoch independently: First, mean absolute amplitude values (MAAV)48 were calculated, along with its preceding 10 s and following 10 s. The MAAV computation was performed on time windows of 0.1 s with 50% overlap as follows:
$$MAAV=\frac{1}{N}\mathop{\sum }\limits_{i=1}^{n}| {x}_{i}|$$
(5)
where N represents the number of samples within each window, and xi denotes the amplitude of the i-th EMG sample. Shapiro-Wilk normality test was conducted twice: first on the filtered EMG signal, and second on its derived MAAV vector. If both Shapiro test statistics crossed specific thresholds (0.95 and 0.9 respectively) the REM epoch was considered as not having any EMG activation and was not proceeded to further analysis. The second step utilized an adaptive threshold for each epoch, set at the 55th percentile of the MAAV vector. This threshold determined the segmentation of EMG muscle activity, where EMG segments were defined when the MAAV vector exceeded this threshold. For each EMG segment the following features were calculated: (a) Median frequency (b) Root mean square (c) Zero-crossing rate: Crossing points with variation smaller than the MAAV-derived threshold removed. (d) FFT peaks Segments considered as having an EMG activation if all of the following criteria were met:
Median frequency
Root mean square > 2 × predefined MAAV derived threshold
Zero-crossing rate > 140
FFT peaks were not found to be power line interference harmonics
Finally, RSWAi was calculated by dividing the duration of EMG activity detected events by the total REM sleep time. To validate the algorithm, automatic detections derived from wearable data were compared with manual PSG detection and with wearable manual detection. Home-based results were compared to the lab to explore stability. The comparisons involved Pearson and Spearman correlations for both algorithm-manual and home-lab results. As mild or obstructive apnea can affect muscle tone, potentially causing patients’ RSWAi to rise, statistical analysis was performed separately for RBD patients, non-RBD subjects with AHI greater than 15, and non-RBD subjects with AHI smaller than 15. These analyses included Pearson and Spearman correlation, Wilcoxon signed-rank, and paired t-tests. The effects of sex, age, and AHI on RSWA were examined using paired t-test and Pearson’s correlation.
RBD classification
An optimization process was employed to determine the optimal threshold for RBD detection based on the novel algorithm outputs, RSWAi. The ideal threshold was explored for its ability to identify subjects with a clinical diagnosis of RBD. Analysis was conducted on both home and lab wearable system sessions. RSWA indices as calculated by the algorithm were split into a randomly balanced 60% training set and a 40% testing set. Training and testing sets consisted of different subjects to avoid data leakage. Receiver operating characteristic (ROC) analysis was used to assess the ability to differentiate between RBD and non-RBD subjects. The optimal threshold was selected by maximizing Youden’s Index (sensitivity-specificity). Subsequently. This threshold was applied to the test datasets for the evaluation of the RSWAi. Sensitivity, specificity, and balanced accuracy were calculated to assess the performance of the novel criteria.