The MED-HOT index is designed to assess climate vulnerabilities in the Mediterranean region by integrating changes in the frequency and intensity of four extreme climate indicators: extreme maximum temperature (TX90), extreme high minimum temperature (TN90), extreme precipitation (P95), and consecutive dry days (CDD). This index reflects the primary climate challenges faced in the region, including heatwaves and droughts. To compute the MED-HOT index, the analysis divides the available data into two periods: the early historical period (1981–2000) and the late historical period (2001–2022). For each index, the frequency and intensity of extreme events are calculated and then normalized. The final MED-HOT index is derived by summing the normalized differences in frequency and intensity across the four indicators, providing a comprehensive measure of climate vulnerability. While the theoretical maximum value of 8 can be achieved if all eight components reach their normalized maximum value of 1, this scenario is highly improbable in practice. Each grid point is analyzed independently, and it is unlikely for a single grid point to exhibit the maximum values for all eight components simultaneously. For instance, a grid experiencing the maximum value of extreme temperature (TX90) often does not coincide with the grid experiencing the maximum value of the P95 precipitation index. These extremes typically occur under different climatic regimes and locations. Additionally, both the frequency and intensity of each indicator are analyzed separately, making it even rarer for a grid point to exhibit the maximum values for both components at the same time. For example, a location experiencing the most frequent extreme precipitation events may not record the highest precipitation intensity simultaneously. This further decreases the chances of reaching the theoretical maximum. As a result, the observed MED-HOT values across the Mediterranean range from zero to three. Nevertheless, these values still represent significant climate extremes and should not be interpreted as indicating only moderate impacts of climate change (Fig. 1).
It’s important to clarify that the MED-HOT index is comparative, following the definition used in Giorgi’s RCCI index. A lower value of the MED-HOT index does not necessarily indicate a small absolute change within a grid point. Instead, it reflects a smaller climate response relative to other grid points in the study area. This approach highlights the relative changes in climate response across the region, rather than directly measuring the absolute magnitude of change.To better understand the index’s spatial distribution, values have been classified into five categories (Fig. 1). Areas with index values below one are categorized as the first class, indicating minor changes and non-hotspot areas. The remaining areas are divided into four additional categories, each with a 0.5 range. This classification allows us to effectively capture the variability of both indices while minimizing the introduction of noise.
The classification of the MED-HOT index is depicted in Fig. 1. The western part of the Iberian Peninsula, along with the majority of central and eastern parts of North Africa, fall within the first class, indicating relatively low MED-HOT values compared to other areas. The next two classes, with MED-HOT values from 1 to 2, are the most prevalent. Almost all grids located in the western part of the studied area (latitudes lower than 10 degrees north) belong to these two classes. Additionally, a significant extent of the Balkan Peninsula, as well as the central and northeastern parts of the studied area, fall into these two classes. In the last two classes, where the index reaches its maximum values, the areas become more specific. Particularly, the eastern regions of Spain, the Dalmatian coast, the Alps, limited regions in the eastern Mediterranean, and areas of northern Greece and Turkey exhibit the highest values of the MED-HOT index.

Spatial variability of MED-HOT index classes.
A more focused analysis resulting in selecting the sub-areas with the highest response to climate change within the Mediterranean is presented in Fig. 2. To ensure an accurate selection a two-step analysis was made.
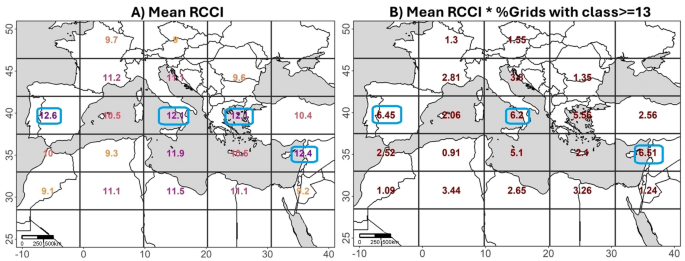
Firstly, the mean value of the MED-HOT index for each of the 20 sub-regions was calculated (Fig. 2A). In the second step, a deeper procedure was applied, with the results shown in Fig. 2B. Specifically, the number of grid points in each sub-area was computed, along with the number of grids falling within the highest two classes of the index. Next, the percentile rank of each grid box within these high-value classes was determined. This percentile rank was then multiplied by the mean value of the index for each grid box. This method ensures that sub-areas with both very high and very low MED-HOT values give more weight to significant changes. As a result, the overall behavior is not obscured by averaging, and significant changes are highlighted.
The results reveal that the areas with the highest index values are the southeastern coast of the Mediterranean (no. 10 Fig. 7—Israel area—ISR), the northern part of Greece (no 19 Fig. 7—GR), and the part of Northern Italy and the Dalmatian coast (NIT). The index values for all three hotspot areas are very close, with the highest recorded in the ISR sub-area.

(A) Mean value of the MED-HOT index for the 30 Mediterranean sub-areas. (B) Mean MED-HOT index values multiplied with the percentile of gridpoints belonging into the two greatest classes for each sub-area. The blue circles highlight the sub-areas with the highest MED-HOT index values, indicating climate hotspots.
Classification of RCCI index and its spatial analysis
The RCCI is classified into five distinct classes, with higher values indicating regions experiencing more pronounced changes compared to others within the study area.
Figure 3 illustrates the spatial distribution of the classified RCCI index. According to this index, regions exhibiting a low response to climate change include parts of the Balkan Peninsula, northwest Africa, central Italy, and the southeastern domain. Areas displaying moderate change are predominantly observed across much of northern Africa, with notable concentrations around regions exhibiting the highest RCCI values, such as the Iberian Peninsula, Alps, Dalmatian coast, northern Greece, Cyprus, and adjacent coastal areas.

Spatial variability of RCCI index classes.
To better delineate hot spot areas according to the RCCI index, we conducted a similar extensive analysis as followed before for the MED-HOT index (Fig. 4). According to this index-secondary analysis (Fig. 4B), the three sub-areas which should be characterised as hot spots are the box that includes the island of Cyprus (no. 15 Fig. 7—CY), the one where the Iberian Peninsula is located (no. 16 Fig. 7—IB) and the sub-area including southern Italy and parts of Sicily (no. 18 Fig. 7—SIT). It is worth mentioning that the sub-area where North Greece belongs can be characterized as a hotspot area according to the mean value of the RCCI index, as it has the same value (12.1) as the next sub-area of South Italy. However, according to the secondary analysis where the number of the grid points with very high values have an extra weight, the area of South Italy has a more significant response to climate change.
(A) Mean value of the RCCI index for the 30 Mediterranean sub-areas. (B) Mean RCCI index values multiplied with the percentile of gridpoints belonging into the two greatest classes for each sub-area. The blue circles highlight the sub-areas with the highest RCCI index values, indicating climate hotspots.
Definition and assessment of hotspot areas
Six hot spot regions can be identified by combining the results of the MED-HOT and RCCI indices. According to historical changes, these regions are considered the most vulnerable to climate change in the Mediterranean. Figure 5 displays these areas: hotspots identified by the RCCI index are shown in yellow, while those identified by the MED-HOT index are shown in orange. Each hotspot area is given an acronym, mainly based on the country that covers the largest part of the area. The identified hotspot regions that are the most vulnerable areas due to recorded changes in mean temperature and precipitation values are: ‘IB’ for the Iberian Peninsula, ‘SIT’ for south Italy, and ‘CY’ for Cyprus. North Italy (‘NI’), Greece (‘GR’), and Israel (‘ISR’) are hot spots due to changes in extreme climate events. For each of these sub-areas, an analysis of the contribution of each factor to the final value of the respective index (MED-HOT or RCCI) was conducted and is presented in Fig. 6.
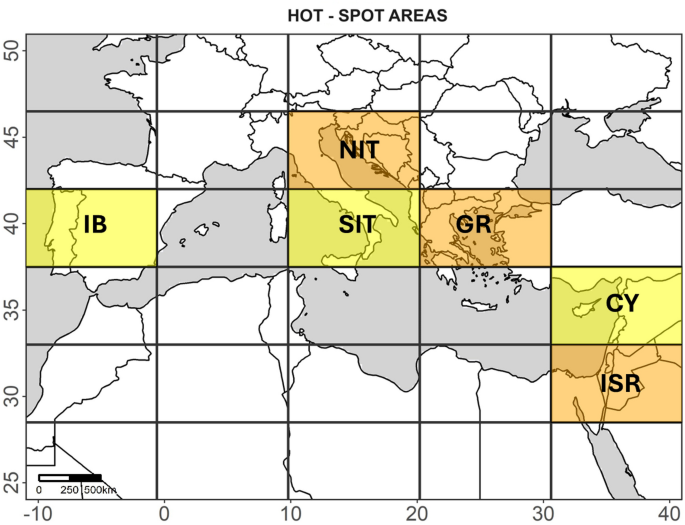
Hotspot areas according to the MED-HOT (orange) and RCCI (yellow) indices.
The relative (%)contributions of the indices to the MED-HOT index value are illustrated in the top panel of Fig. 6. The results indicate that the change in the maximum temperature is the dominant factor, exceeding 25% while extreme rainfall and drought indices contribute less than 20% in the three selected areas. For Israel and Greece, it appears that the hot spot definition is based on changes in the maximum values of extreme temperatures (TX90 and TN90), leading to warmer days and nights. In Northern Italy (NIT), the hot spot region is characterized by a 51.5% change in the frequency and intensity of maximum temperatures, resulting in both more frequent and higher maximum temperatures.

Contribution (%) of the final value of the MED-HOT and RCCI indices for eight sub-areas.
However, when calculating the RCCI index for these areas, it is revealed that changes in average precipitation during either the wet or dry season account for more than 50% of the index (Fig. 6—RCCI). Specifically, in Greece, the most significant factor is the change in average rainfall during the dry season. Conversely, in Israel, the variance in average precipitation throughout the year contributes nearly 50% to the index. In northern Italy (NI), the index is characterized by changes in both the average precipitation and its variance during the wet season.
The plot for the RCCI in the bottom panel of Fig. 6 illustrates the contribution of various factors during wet and dry periods. The highest contribution to the definition of hot spot areas according to the RCCI index comes from changes in rainfall, which contrasts with the results of the MED-HOT index. The exception is the area of Cyprus, where there seems to be a balance between historical changes in average temperature and precipitation. In the Iberian (IB), the significant factor is the change of the variance in precipitation during the dry period of the year (20.8%), while in southern Italy (SIT), changes in rainfall and its variance during the wet period are the key characteristics of the hot spot region. For Cyprus (CY), the region is mainly characterized by changes in temperature variance (20.5%) during the dry period, and the RWAF factor (19%), representing the change in regional mean surface air temperature relative to the Mediterranean average temperature change for the wet period.
When calculating the MED-HOT index for these three regions (Fig. 6—MED-HOT), distinct factors contribute significantly. The common characteristic across all three regions is the notable change in the temperature indices (higher than 70%). However, in Cyprus (CY), changes in maximum minimum temperatures combined with alterations in the drought index account for 50% of the MED-HOT index. In IB, the second primary contributing factor is the change in the drought index, while for southern Italy (SI), the index is largely influenced by changes in the frequency of extreme precipitation.