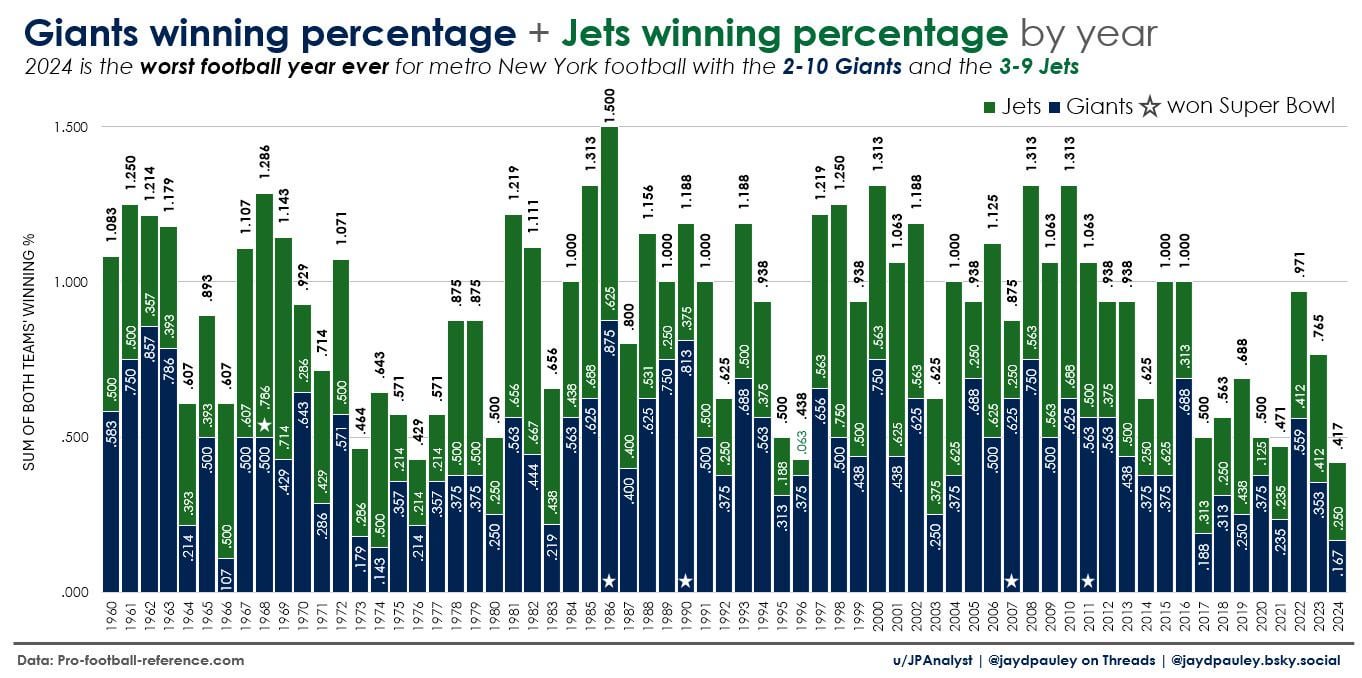
[OC] The 2-10 NY Giants and the 3-9 NY Jets have (so far) combined to give metro New York their worst season ever in NFL/AFL history. (NFL, American football)
Posted by JPAnalyst
[OC] The 2-10 NY Giants and the 3-9 NY Jets have (so far) combined to give metro New York their worst season ever in NFL/AFL history. (NFL, American football)
Posted by JPAnalyst
2 comments
Source: [Pro Football Reference](https://www.pro-football-reference.com/teams/nyg/index.htm)
Chart: Excel
I felt like this could be a unique year in terms of how bad the Jets and Giants are collectively. So I looked at every year‘s winning percentage and added the two together to find out. And it turns out, we are doing something magical this year. We are making history. This year‘s Giants and this year‘s Jets are in fact combining to make the worst metro New York season ever.
The chart:
This is a stacked bar chart showing in blue the Giants winning percentage and on top of that and green the Jets winning percentage and I’m adding the two winning percentages and putting that number at the top. I identified Super Bowl winners with a star inside the bar. It seems kind of weird to add two winning percentages together rather than just use the actual combined winning percentage, but I played around with this a little bit and I really wanted a stacked bar. I could plot the blended winning percentage as a line, but then the numbers from the line would overlap with the bars and I think it would be even messier. Another chart design choice I considered was using three lines; one for the Giants, one for the Jets, and one for the combined winning percentage (not the sum of winning percentages), but again you would see a lot of those lines (or dots, if I eliminate the lines) very close together and overlapping. So this is where I landed hopefully it’s not confusing.
Apologies to Seattle fans, but when you combine Giants blue with Jets green, you get the Seahawks.
Had to balance out from the Mets/Yankees season last year
Comments are closed.