In what context? Are you trying to say that workplace injuries have gone up? Or that the percentage of disabled people who are employed has risen?
Cool to learn d3 (it’s quite powerful) but this graph isn’t saying anything of importance.
There’s been research localized to county level employment that shows as employment levels dip by county, disability claims rise in direct proportion. Basically declining job prospects in rural counties have correlated with a massive increase in disability claims in those counties.
Long covid has hit the workforce hard, and will continue to do so.
What happened in 2020? Does COVID survivor count as a disability?
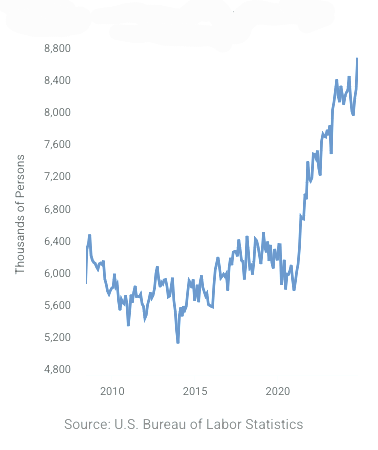
This y-axis needs to start at zero to show the relative increase accurately.
The visualization here chose to cover the range of data, which results in essentailly two levels of Y. That binary outcome minimizes the amount of information visualization conceys.
What’s happening is that more disabled entered the labor force because there are so many more WFH jobs. Being able to WFH, even 2-3 days a week, reduces or eliminates many of the barriers to work.
If this data is what I think it is, the page at the end of job applications that asks if you have a disability, I will point out that it counts quite a broad range of conditions.
For example, I have Crohn’s. It’s specifically listed on that sheet as an example of a disability. And while it certainly is a serious chronic medical condition, it’s not what people might generally think of as a disability.
I’m of course not trying to say that these conditions should not be considered disabilities. Just that there are more broad and more narrow definitions of disability (for example, I couldn’t get a disabled placard), and we should be aware of what specifically the data is referring to.
This chart is not beautiful because it starts at 4,800. It makes it modern increase look like it massive increase.
Shame. Shame.
I’ve been disabled for years now but I’m not counted in this because a judge told me to go fuck myself. I wonder how many others are unable to work, but aren’t counted as disabled because they were denied disability
Yep. the trough right before it spikes up is Jan 2021 when large scale roll-out of an an experimental genetic treatment began. No time period in history shows a similar increase, it isn’t seen in the Dot com recession or the GFC recession….
edit: All through 2020 during the worse delta variant the disability numbers fell.
Due to increase in the diagnosis of mental disabilities?
One thing I would like to know, what things are classified as a disability today that weren’t say 20-25 years ago
13 comments
Tool: d3.js
Data source: https://fred.stlouisfed.org/series/LNU01074597
In what context? Are you trying to say that workplace injuries have gone up? Or that the percentage of disabled people who are employed has risen?
Cool to learn d3 (it’s quite powerful) but this graph isn’t saying anything of importance.
There’s been research localized to county level employment that shows as employment levels dip by county, disability claims rise in direct proportion. Basically declining job prospects in rural counties have correlated with a massive increase in disability claims in those counties.
Long covid has hit the workforce hard, and will continue to do so.
What happened in 2020? Does COVID survivor count as a disability?
This y-axis needs to start at zero to show the relative increase accurately.
The visualization here chose to cover the range of data, which results in essentailly two levels of Y. That binary outcome minimizes the amount of information visualization conceys.
What’s happening is that more disabled entered the labor force because there are so many more WFH jobs. Being able to WFH, even 2-3 days a week, reduces or eliminates many of the barriers to work.
If this data is what I think it is, the page at the end of job applications that asks if you have a disability, I will point out that it counts quite a broad range of conditions.
For example, I have Crohn’s. It’s specifically listed on that sheet as an example of a disability. And while it certainly is a serious chronic medical condition, it’s not what people might generally think of as a disability.
I’m of course not trying to say that these conditions should not be considered disabilities. Just that there are more broad and more narrow definitions of disability (for example, I couldn’t get a disabled placard), and we should be aware of what specifically the data is referring to.
EDIT: Here is the form: https://www.dol.gov/agencies/ofccp/self-id-forms
This chart is not beautiful because it starts at 4,800. It makes it modern increase look like it massive increase.
Shame. Shame.
I’ve been disabled for years now but I’m not counted in this because a judge told me to go fuck myself. I wonder how many others are unable to work, but aren’t counted as disabled because they were denied disability
Yep. the trough right before it spikes up is Jan 2021 when large scale roll-out of an an experimental genetic treatment began. No time period in history shows a similar increase, it isn’t seen in the Dot com recession or the GFC recession….
edit: All through 2020 during the worse delta variant the disability numbers fell.
Due to increase in the diagnosis of mental disabilities?
One thing I would like to know, what things are classified as a disability today that weren’t say 20-25 years ago
Comments are closed.