Does your data have absolute usage? The one thought i had was how big was that market at X date.
Thank you for slowing it down this time! I was actually able to follow and even read the information and thus learned Firefox came from Netscape. I never knew that before.
The only thing I would add is a few seconds at the end to look at the final market share before it loops
When a giga corp consumes all of the industry.
Neat infograph. I remember when Firefox came out, man I feel old. lol These days I use Chrome or Opera. The new Opera is actually pretty good.
Brave is way underrated.
Ad blocker and Tracker build in which is also amazing for normy users which usually don’t use extensions.
Lower Memory Usage.
Good AI summary in search but also works on youtube, again no extension needed.
and of course all chrome extensions work too
Excellent visualization. I like how you can see Chrome pushing the others into a smaller and smaller area while they compete with each other for space.
8 comments
– [View it yourself here](https://plotapi.com/explore/view/563abc04-f196-4992-aefe-973b91f5c639) – [Mobile version](https://plotapi.com/explore/view/1a8c6d09-b648-4dd9-a553-14d7637c8808)
– Made with [PlotAPI.com](https://plotapi.com) and Python
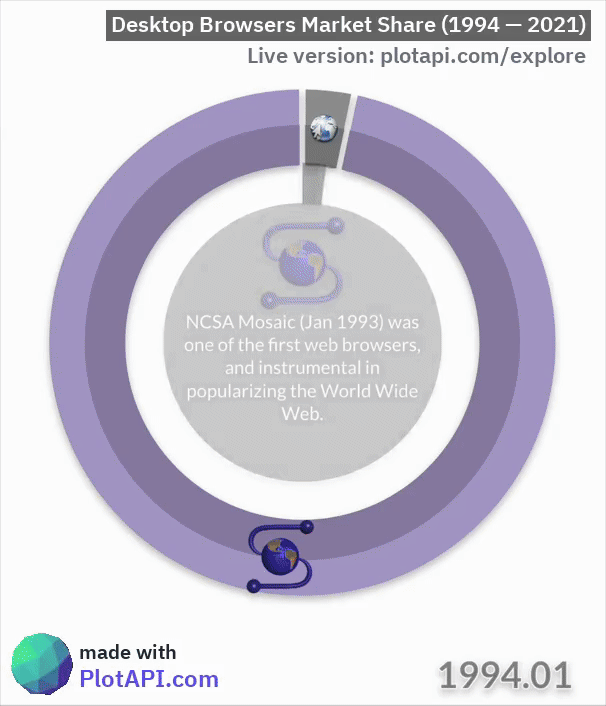
– Data: 1994 – 1995: GVU WWW user survey, 1996 – 1998: EWS Web Server at UIUC, 1999 – 2001: WebSideStory, 2002 – 2008: OneStat.com, 2009-2021: StatCounter
– This is a [Pie Chart Race](https://plotapi.com/docs/visualizations/piefight/)
this is a cool evolution of the previous one.
Does your data have absolute usage? The one thought i had was how big was that market at X date.
Thank you for slowing it down this time! I was actually able to follow and even read the information and thus learned Firefox came from Netscape. I never knew that before.
The only thing I would add is a few seconds at the end to look at the final market share before it loops
When a giga corp consumes all of the industry.
Neat infograph. I remember when Firefox came out, man I feel old. lol These days I use Chrome or Opera. The new Opera is actually pretty good.
Brave is way underrated.
Ad blocker and Tracker build in which is also amazing for normy users which usually don’t use extensions.
Lower Memory Usage.
Good AI summary in search but also works on youtube, again no extension needed.
and of course all chrome extensions work too
Excellent visualization. I like how you can see Chrome pushing the others into a smaller and smaller area while they compete with each other for space.
Comments are closed.