* Top 10 Players on avg are paid 124% more today than the ’96 era
* Top 10 players on avg are playing 9.5% less games/minutes
* Top 10 Players on avg are typically 26-28 years old
* Top 10 Players are shooting 88% more three pointers today than ’96 era
* Top 10 Players on only scoring 16% more points today vs ’96 era
This has nothing to do with performance. The game has changed and it’s basically a 3pt contest now, with loose defense.
neat! couple questions: how are you defining top 10 players? you’re using per game stats – what are your minutes and games played limits? would this look different if you used totals?
Great view. If you can, for losses, I’d recommend the worst 10 teams to evaluate if tanking is still as strong as it was…and it’ll avoid it just being the inverse of wins as it is now.
Sigh… the data is great but man – this is like ‘using scale to display data 101’; the bars are far too similar to be visually-valuable. Break this up across a few images and enhance the scale so we can really easily see the minute differences.
Edit: I want to reinforce – I love this data. I love it so much I want it to be better and easier to pick out trends.
Think the math only works if field goals are actually 2pt field goals, right?
Which would also be the only way it makes sense that FG% can have gone up to over 50% —- because TWO POINT field goals have gotten closer to the basket and easier with spacing, but I think total FG% is down because of the increase in threes taken
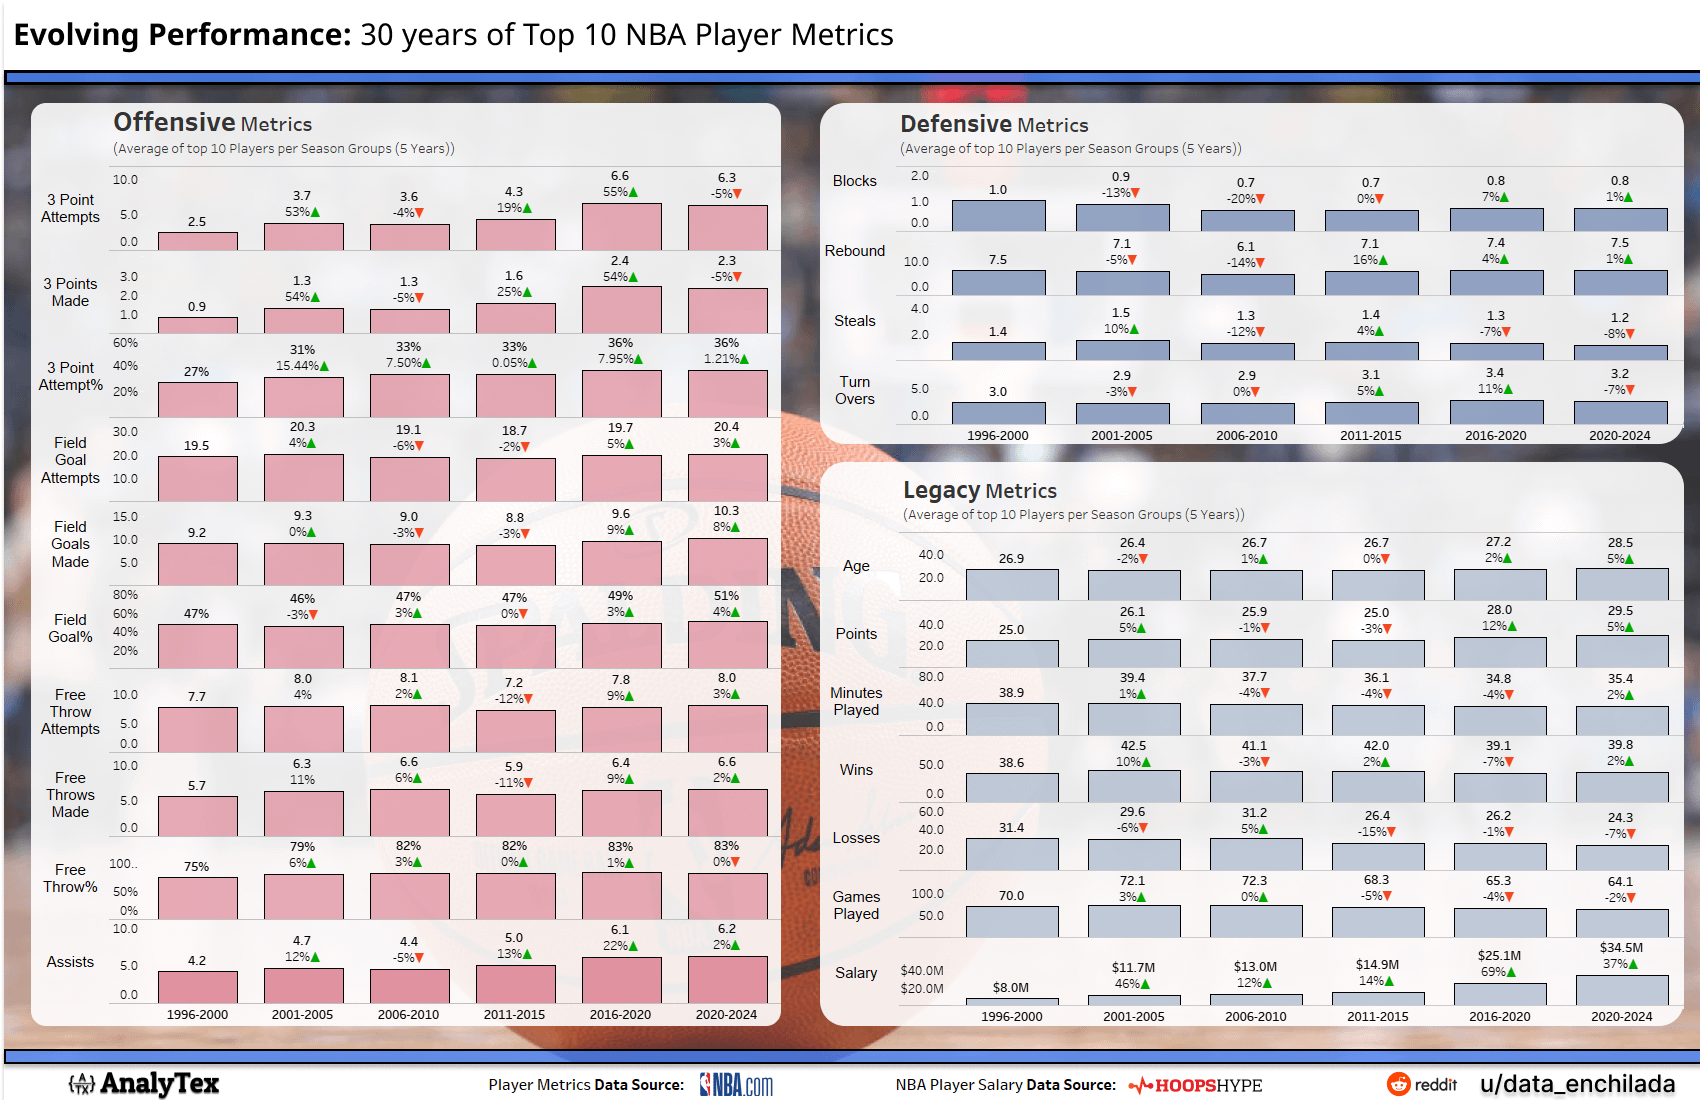
![[OC] Evolving Performance: 30 Years of Top 10 NBA Player Metrics](https://www.europesays.com/wp-content/uploads/2024/12/93imn1yxz08e1-1700x1024.png)
8 comments
Dude this is awesome. Thanks for making!
**Analysis Topic:** Is the NBA as a product changing over time?
**Inspiration:** [The Big Podcast with Shaq: Shaq Thinks Steph Ruined The NBA. Here’s Why…](https://youtu.be/ZJaYIAwwTbI?feature=shared)
After hearing out [#Shaq](https://www.linkedin.com/feed/hashtag/?keywords=shaq&highlightedUpdateUrns=urn%3Ali%3Aactivity%3A7275591538775113729) on how he currently see’s the #NBA as a product and where it’s going, I decided to find open source data to test his hypothesis using #Tableau TLDR- Shaq was right!
TOP TAKE AWAYS:
* Top 10 Players on avg are paid 124% more today than the ’96 era
* Top 10 players on avg are playing 9.5% less games/minutes
* Top 10 Players on avg are typically 26-28 years old
* Top 10 Players are shooting 88% more three pointers today than ’96 era
* Top 10 Players on only scoring 16% more points today vs ’96 era
[Dashboard Link ](https://public.tableau.com/app/profile/data.enchilada/viz/NBA_Top10_Data_25Nov24/NBATrendsOver30Years)
[Analysis Video](https://www.youtube.com/watch?v=b4z_UcYUWtQ)
This has nothing to do with performance. The game has changed and it’s basically a 3pt contest now, with loose defense.
neat! couple questions: how are you defining top 10 players? you’re using per game stats – what are your minutes and games played limits? would this look different if you used totals?
Great view. If you can, for losses, I’d recommend the worst 10 teams to evaluate if tanking is still as strong as it was…and it’ll avoid it just being the inverse of wins as it is now.
Sigh… the data is great but man – this is like ‘using scale to display data 101’; the bars are far too similar to be visually-valuable. Break this up across a few images and enhance the scale so we can really easily see the minute differences.
Edit: I want to reinforce – I love this data. I love it so much I want it to be better and easier to pick out trends.
Think the math only works if field goals are actually 2pt field goals, right?
Which would also be the only way it makes sense that FG% can have gone up to over 50% —- because TWO POINT field goals have gotten closer to the basket and easier with spacing, but I think total FG% is down because of the increase in threes taken
If anyone interested in going into the weeds, I included a filter for the players themselves and an axis parameter so user can change the date parts from 5 years to 10 years on the viz [dashboard](https://public.tableau.com/app/profile/data.enchilada/viz/NBA_Top10_Data_25Nov24/NBATrendsOver30Years)
Comments are closed.