$$GTU{M}_{it}={\alpha }_{0}+{\alpha }_{1}DE{C}_{it}+{\alpha }_{2}{X}_{it}+{u}_{i}+{\delta }_{t}+{\varepsilon }_{it},$$
(1)
In Eq. (1), DECit and GTUMit represent DEC and GTUM levels in province i and time t, respectively. Xit represents a series of control variables. μi denotes province-fixed effects, δt represents time-fixed effects, and εit denotes the random error term.
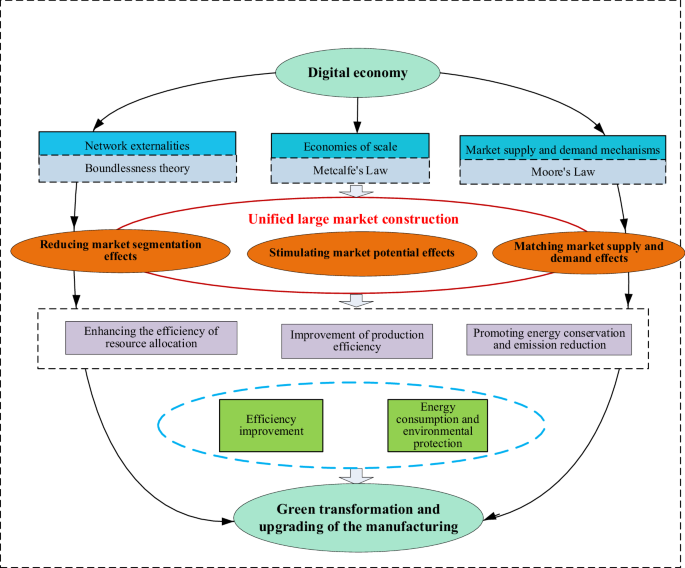
Furthermore, to explore the mechanisms through which DEC influences GTUM, this study introduces a series of mechanism variables and constructs the following model:
$${M}_{it}={\beta }_{0}+{\beta }_{1}DE{C}_{it}+{\beta }_{2}{X}_{it}+{u}_{i}+{\delta }_{t}+{\varepsilon }_{it},$$
(2)
Equation (2) represents the DEC regression equation for the mediating variables (Mit), where other variables are the same as in Eq. (1).
Random forest model
Building on Hypothesis 3, this study employs a machine learning-random forest model to analyze the real non-linear effects of DEC on GTUM. This approach is justified for two major reasons. First, the development of DEC aligns with Metcalfe’s Law and is likely to exhibit non-linear characteristics. Second, traditional statistical models have limitations in accuracy. To achieve higher precision, machine learning models, including black box models, are utilized to investigate the real non-linear impacts of DEC on GTUM, ensuring that the overall model results possess high accuracy and generalizability. The following model is constructed:
$$GTU{M}_{it}=f(DE{C}_{it},{X}_{it},{u}_{i},{\delta }_{t},{\varepsilon }_{it}),$$
(3)
where f (⋅) represents the non-linear model constructed using the random forest method; other variables are the same as in Eq. (1).
First, given any black box model, a partial dependence function is defined as follows:
$${\hat{f}}_{{x}_{s}}({x}_{s})={E}_{{x}_{c}}[\hat{f}({x}_{s},{x}_{c})]=\int \hat{f}({x}_{s},{x}_{c})dP({x}_{c}),$$
(4)
where xs represents the feature variable of interest, and xc represents all other variables. By integrating over xc, a function \(\hat{f}({x}_{s})\) that depends only on xs is obtained. This function is known as the partial dependence function, which allows for interpreting the effect of the single variable xs. In practical terms, the estimate of \({\hat{f}}_{{x}_{s}}\) is obtained by averaging the training data, using the following formula:
$${\hat{f}}_{{x}_{s}}({x}_{s})=\frac{1}{n}\mathop{\sum }\limits_{j=1}^{n}\hat{f}({x}_{s},{x}_{x}^{(i)}),$$
(5)
where \({{x}_{c}}^{(i)}\) represents the actual values of the features in the feature, and space n denotes the sample size, excluding set s in the dataset. Plotting the relationship between different values of the feature variable and the predicted values yields the partial dependence plot. This plot illustrates the marginal effects of DEC on ETFP.
Variable settingExplained variable
GTUM is not only reflected in the upgrading trend from lower to higher levels within the industry but also by reduced energy consumption and enhanced environmental protection, reflecting a comprehensive internal improvement within the manufacturing sector, and thus realizing green manufacturing. Green manufacturing is a modern manufacturing model with low consumption, low emissions, and high efficiency. It serves as a core embodiment of GTUM. Based on policy documents such as “Made in China 2025” and “Guidelines on Deepening the ‘Internet + Advanced Manufacturing’ to Develop the Industrial Internet,” as well as the study on GTUM by Xie and Han, (2022), this study considers that “GTUM” is a composite of the degree of industrial structure upgrading and greening of the manufacturing. Following Li et al., (2019), the GTUM index is constructed and measured using an improved entropy method, as shown in Table 1. Among them, the efficiency dimension represents the degree of upgrading of manufacturing, and the energy consumption and environmental protection (ECEP) dimension represents the degree of greening of the manufacturing industry.
Core explanatory variable
Drawing from Wang et al., (2024), this study constructs a comprehensive evaluation index system for DEC development across four dimensions: the development environment of DEC, digital industrialization, industrial digitalization, and digital governance. As shown in Table 2.
Mechanism variables
(1) Market segmentation (Merc_Seg): This study uses employs the relative price method to calculate the index of factor market segmentation, taking inspiration from Bian et al., (2019). First, three-dimensional panel data concerning time, region, and various factors are required, and the first-order difference of the price loop index measures the relative price.
$$\,\Delta {Q}_{{ijt}}^{k}={ln}\left(\frac{{P}_{{it}}^{k}}{{P}_{{jt}}^{k}}\right)-{ln}\left({P}_{{it}}^{k}-\frac{1}{{P}_{{jt}}^{k}}-1\right),$$
(6)
Second, considering that the calculation of relative prices is affected by the differences brought about by the factors’ own characteristics, the de-meaned method is used to deal with it, and the relative price fluctuation \({q}_{{ijt}}^{k}\) is calculated by the formula:
$${q}_{{ijt}}^{k}=\left|\Delta {Q}_{{ijt}}^{k}\right|-\left|{\overline{\Delta {Q}_{t}^{k}}}\right|,$$
(7)
where \({q}_{{ijt}}^{k}\) is independent of the characteristics of the factors themselves and solely reflects the degree of market segmentation.
Finally, the variance of the portion of the relative price change of factors between each two regions is calculated and combined by province, resulting in a market segmentation index for each province and neighboring provinces:
$${var}\left({q}_{{nt}}\right)=\left[{\sum }_{i\ne j}{var}\left({q}_{{ijt}}\right)/{\rm{N}}\right],$$
(8)
We select the price indices of eight commodity categories such as food, clothing and footwear, and daily necessities for calculation, where N is the number of neighboring provinces.
(2) Market potential (Merc_Pot): Following the method of Midelfart et al., (2000), incorporating the impact of its distance on the economy of the region, market potential is calculated as follows:
$${{Merc{\_}Pot}}_{i}=\mathop{\sum }\limits_{\text{k}=1}^{\text{k}}\frac{{I}_{k}}{{D}_{{ik}}}+\frac{{I}_{i}}{{D}_{{ii}}},$$
(9)
where Merc_Poti represents the market potential of provinces (or cities), and k represents provinces other than province i, I is measured using total retail sales of consumer goods, and Dik represents the spherical distance between provinces, calculated using the coordinates of the center of mass of each province and the distance formula:
$${D}_{{ik}}=\Omega \times \arccos (\cos \left({\alpha }_{o}{\alpha }_{v}\right){\cos {\beta }_{o}\cos \beta }_{v}+\sin {\beta }_{o}\sin {\beta }_{v}),$$
(10)
Self-distance \({D}_{{ii}}=(\frac{2}{3})\sqrt{{S}_{i}/\pi }\), where S is the land area of the province.
(3) Market supply-demand matching (Merc_Sd): Drawing from Hitt et al., (1997) and Chang and Wang, (2007), supply-demand matching refers to the situation where consumers find providers whose products meet quality and price requirements. Producers create diverse products based on market demand, and a company’s level of product diversity is highly correlated with its R&D activities. Therefore, the extent of market supply-demand matching is also reflected i in the sales of new products companies develop. Merc_Sd can be calculated using the sales income from new goods of industrial companies more than a certain size within the region (in trillions), with the values logarithmically transformed.
Control variables
To control for other factors that may influence GTUM in various regions, this study references existing literature and selects the following control variables: Regional economic development level (PGDP), measured by per capita gross domestic product (GDP); Foreign Direct Investment (FDI), measured by the ratio of actual utilized foreign direct investment to the regional GDP; Human capital level (Human_Cap), measured by the average years of education per capita; Degree of government intervention (Gover_Inter), measured by the ratio of general budget expenditures to regional GDP; and Transportation infrastructure (Infra_Trans), measured by road network density.
Data sources
Given the absence of data for Tibet and considering that data for manufacturing sub-sectors are only published at the provincial level, this study employs panel data from 2011 to 2020, integrating provincial data with manufacturing sub-sectors in China. Missing values for some indicators were filled in using linear interpolation. The data sources include the “China Statistical Yearbook,” “China Industrial Yearbook,” provincial statistical yearbooks and statistical bulletins, the Baidu Index, the Guoyan Network, and the EPS Data Platform. Descriptive statistics for the variables are shown in Table 3.
The descriptive statistics of key variables from Table 3 indicate that GTUM in the sample has a certain foundation, but there is still much room for improvement. The standard deviation suggests that the dispersion of GTUM values around the mean is relatively low across regions. The minimum and maximum values reveal that some regions are only at the preliminary stages of GTUM, whereas others have achieved higher levels of GTUM. The average value from DEC shows that the overall development degree of DEC is moderate to low, and the relatively small standard deviation indicates that the development level of DEC in these regions is relatively concentrated. The range of extreme values from 0.071 to 0.610 demonstrates that while some areas are highly developed in terms of DEC, others are comparatively underdeveloped.