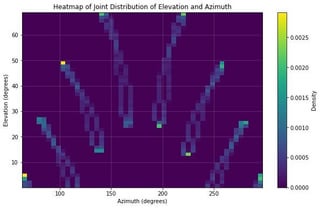
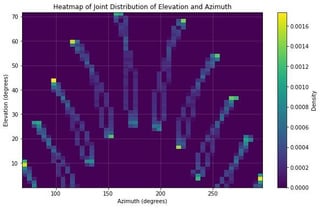
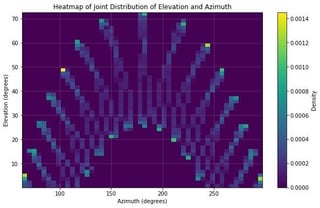
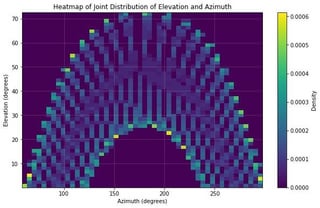
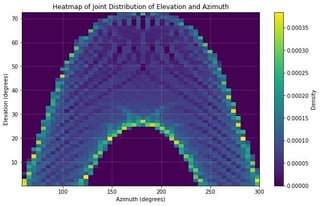
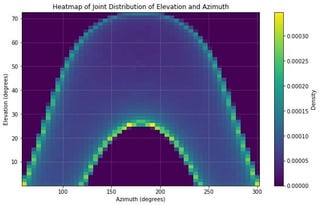
Joint Distribution of the Elevation & Azimuth at six different resolutions:
120 minute
90 minute
60 minute
30 minute
15 minute
1 minute
Created with python code simulating every n minutes over the entire 2024 year (starting at UTC midnight 1/1)
Posted by electricvishnu
4 comments
That is not what I expected, but I guess it makes sense – around the solstices the path doesn’t change much from day to day.
The last shot is interesting.
Smaller bin size must look beautiful.
Got to ask – how did you put text below these images? Last time I checked post editor doesn’t allow any text/description aside from title and short subtitle per image.
The density is basically time (spent in each heatmap grid) right?
It would be nice if the legend presented it as such.
Edit: It would also be interesting to try to visualize it as a line plot, with width relative to “speed”
The integral of the analemmas basically.
Comments are closed.