Hi, I’m starting a new free time project, where I’m exploding visualization of scientific data in artistic but still sensible way.
First visualization: Weather.
Each line in the figure represents trajectory of one weather balloon launched from Jokioinen, Finland in 2020. Line starting point on the circle indicates launch day of the year. Wind direction in different altitudes can be observed from the line direction. Line color indicates air temperature difference to the yearly average at the measurement altitude.
Even with your explanation I have no idea what I am looking at, sorry.
r/weather might appreciate this more.
The circular calendar makes it look like the earth and makes it seem it is geographically oriented. It is beautiful looking though. A linear calendar might make it more readable.
I’m a meteorologist and this is a bit of a struggle for me. Whats the story you are trying to tell here?
Are they x-y trajectories? Or is there some vertical component plotted? If x-y, you should include a compass cross somewhere as a legend.
Why use a temperature anomaly from an average annual temperature as the color (if I’ve understood that correctly)? It changes with too many variables (weather, season, altitude). What are you trying to show with colors? If color is meant to show the altitude, just color it as a function of pressure. Currently it’s just showing the season which I can already glean from the circle.
I love this, and as an avid weather balloon chaser, the data makes immediate sense to me. It’s also definitely beautiful, especially when I click for the high-res.
I’m surprised to see so few mid-flight reversals; often balloons from my site make zig-zags as the jetstream is moving a completely different direction from lower level winds, but that’s part of what’s so interesting about this! Your July looks like my year-round.
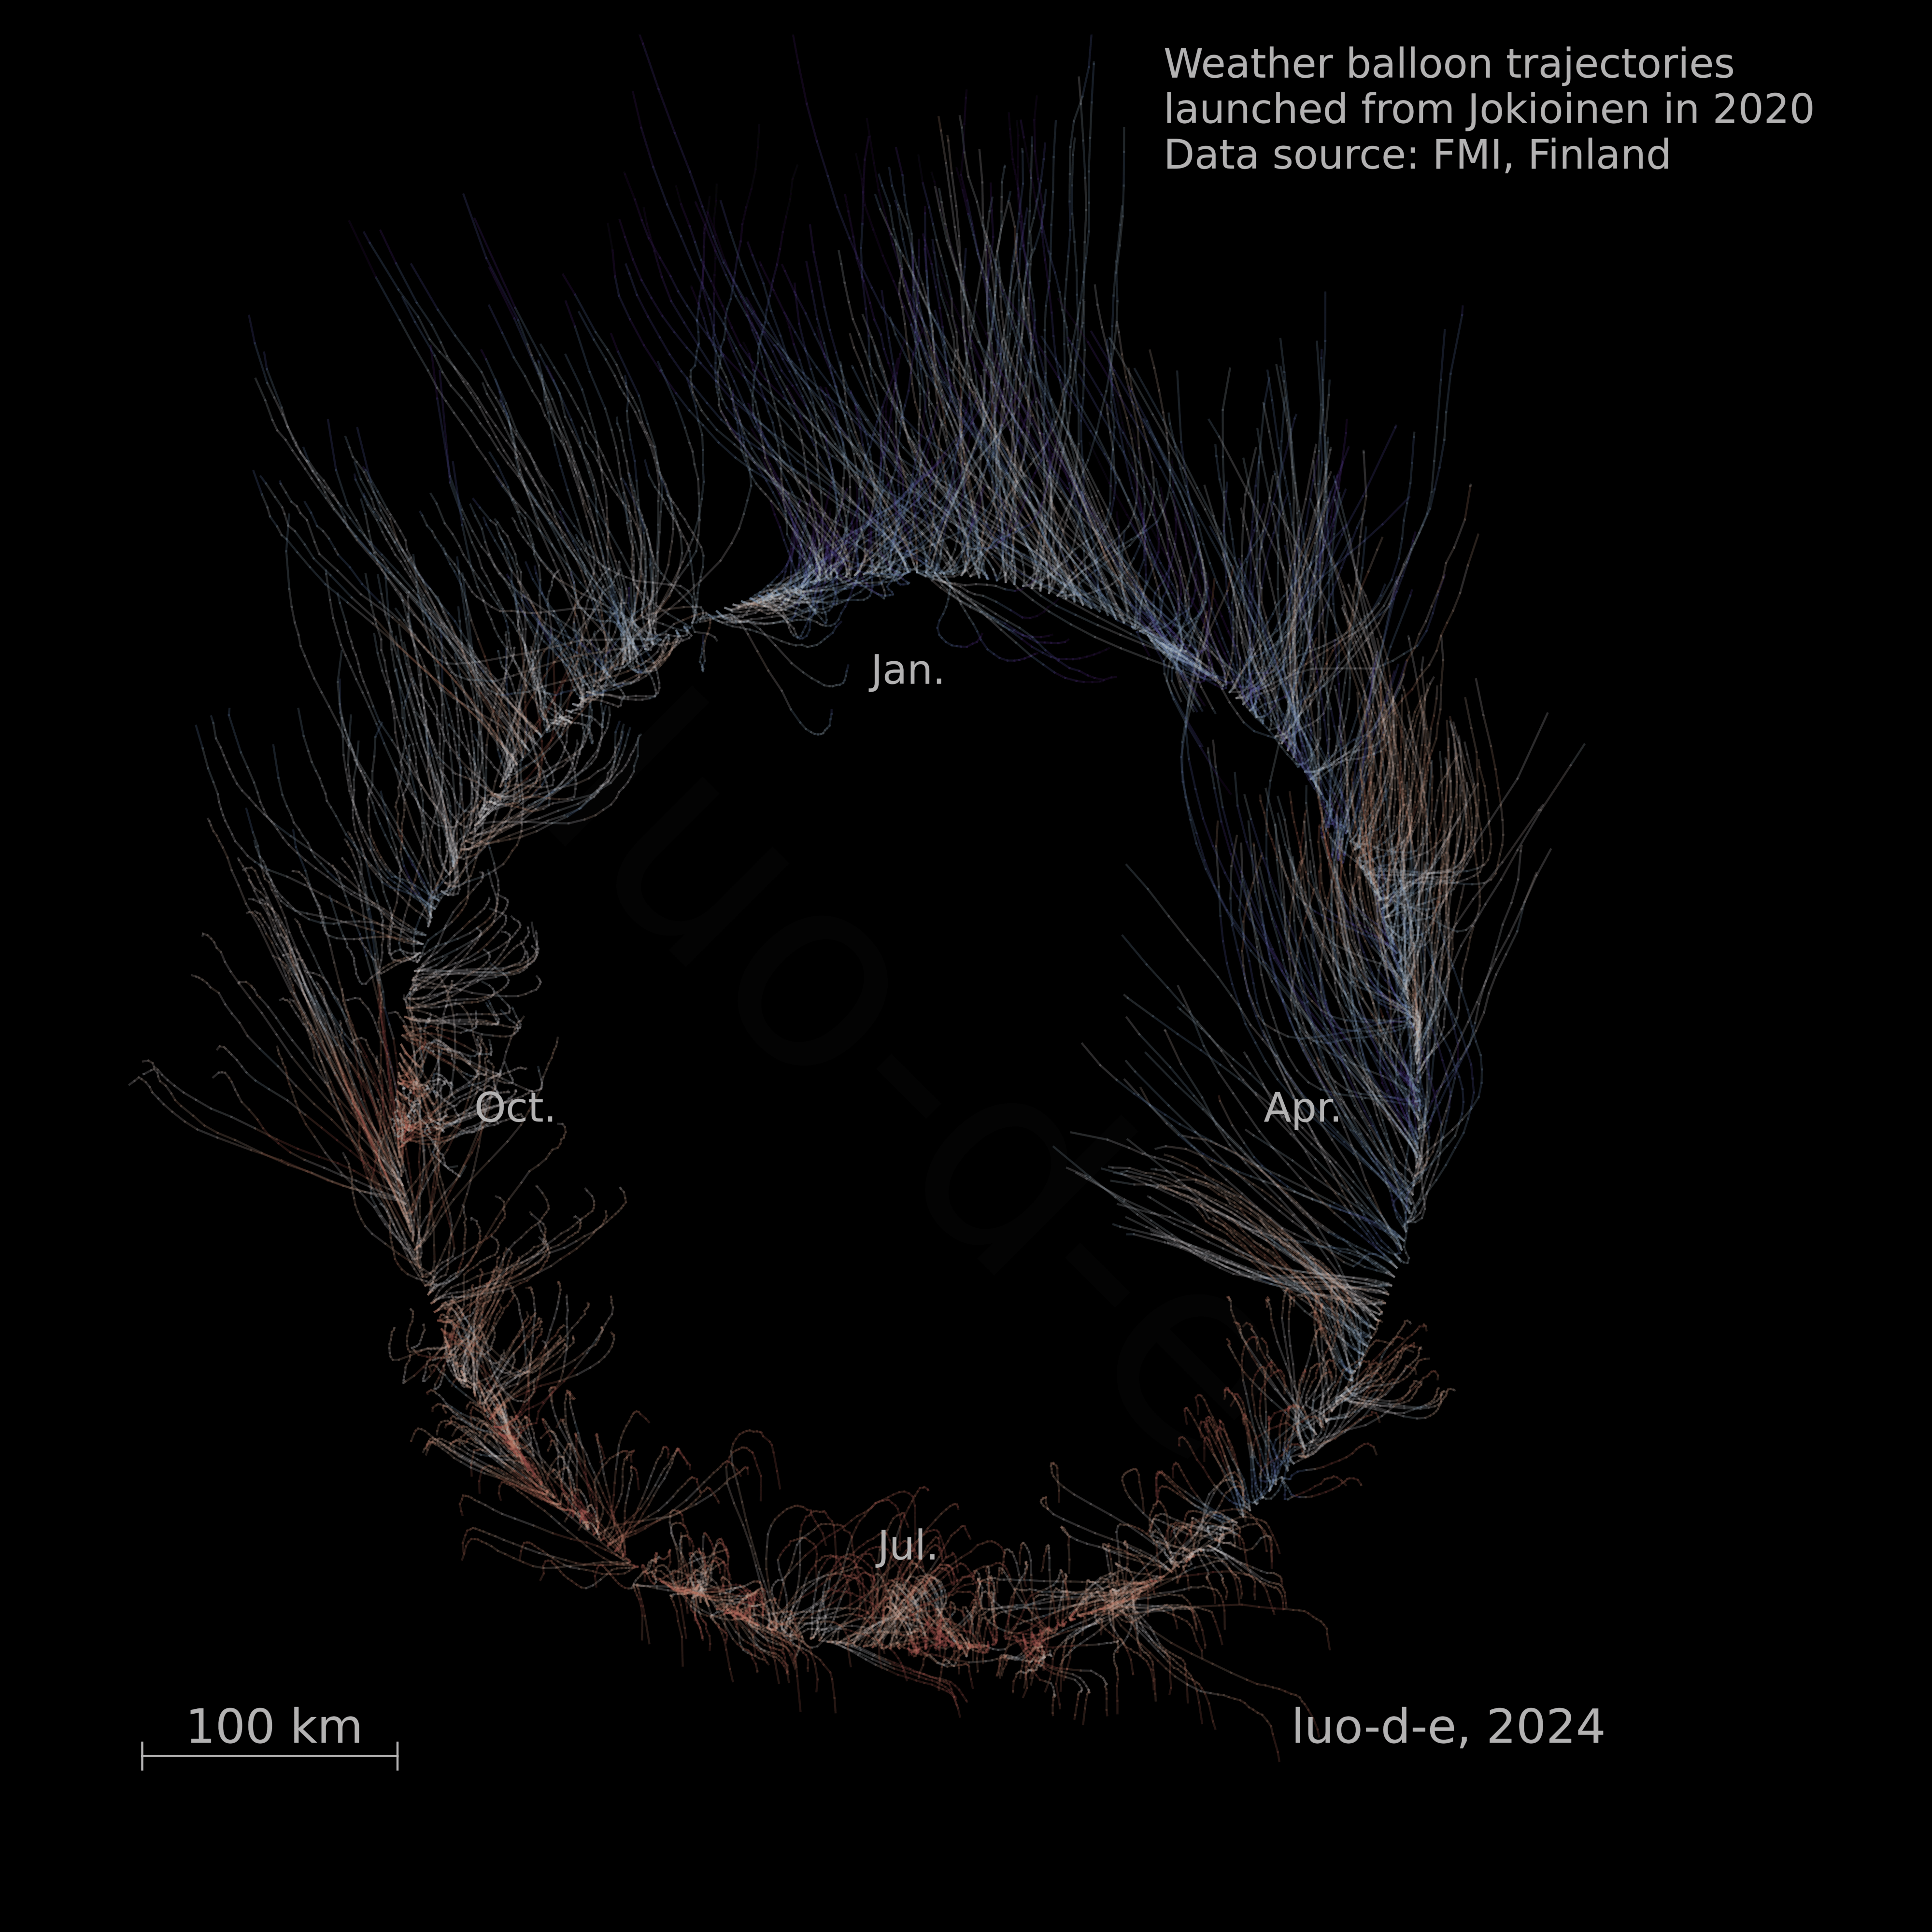
![[OC] Weather balloon trajectories over one year](https://www.europesays.com/wp-content/uploads/2024/12/q1xzsu9sde8e1-1920x1024.png)
6 comments
Hi, I’m starting a new free time project, where I’m exploding visualization of scientific data in artistic but still sensible way.
First visualization: Weather.
Each line in the figure represents trajectory of one weather balloon launched from Jokioinen, Finland in 2020. Line starting point on the circle indicates launch day of the year. Wind direction in different altitudes can be observed from the line direction. Line color indicates air temperature difference to the yearly average at the measurement altitude.
Tools: Python Numpy and Matplotlib
Data source: FMI open data [https://en.ilmatieteenlaitos.fi/open-data](https://en.ilmatieteenlaitos.fi/open-data)
Even with your explanation I have no idea what I am looking at, sorry.
r/weather might appreciate this more.
The circular calendar makes it look like the earth and makes it seem it is geographically oriented. It is beautiful looking though. A linear calendar might make it more readable.
I’m a meteorologist and this is a bit of a struggle for me. Whats the story you are trying to tell here?
Are they x-y trajectories? Or is there some vertical component plotted? If x-y, you should include a compass cross somewhere as a legend.
Why use a temperature anomaly from an average annual temperature as the color (if I’ve understood that correctly)? It changes with too many variables (weather, season, altitude). What are you trying to show with colors? If color is meant to show the altitude, just color it as a function of pressure. Currently it’s just showing the season which I can already glean from the circle.
I love this, and as an avid weather balloon chaser, the data makes immediate sense to me. It’s also definitely beautiful, especially when I click for the high-res.
I’m surprised to see so few mid-flight reversals; often balloons from my site make zig-zags as the jetstream is moving a completely different direction from lower level winds, but that’s part of what’s so interesting about this! Your July looks like my year-round.
Comments are closed.