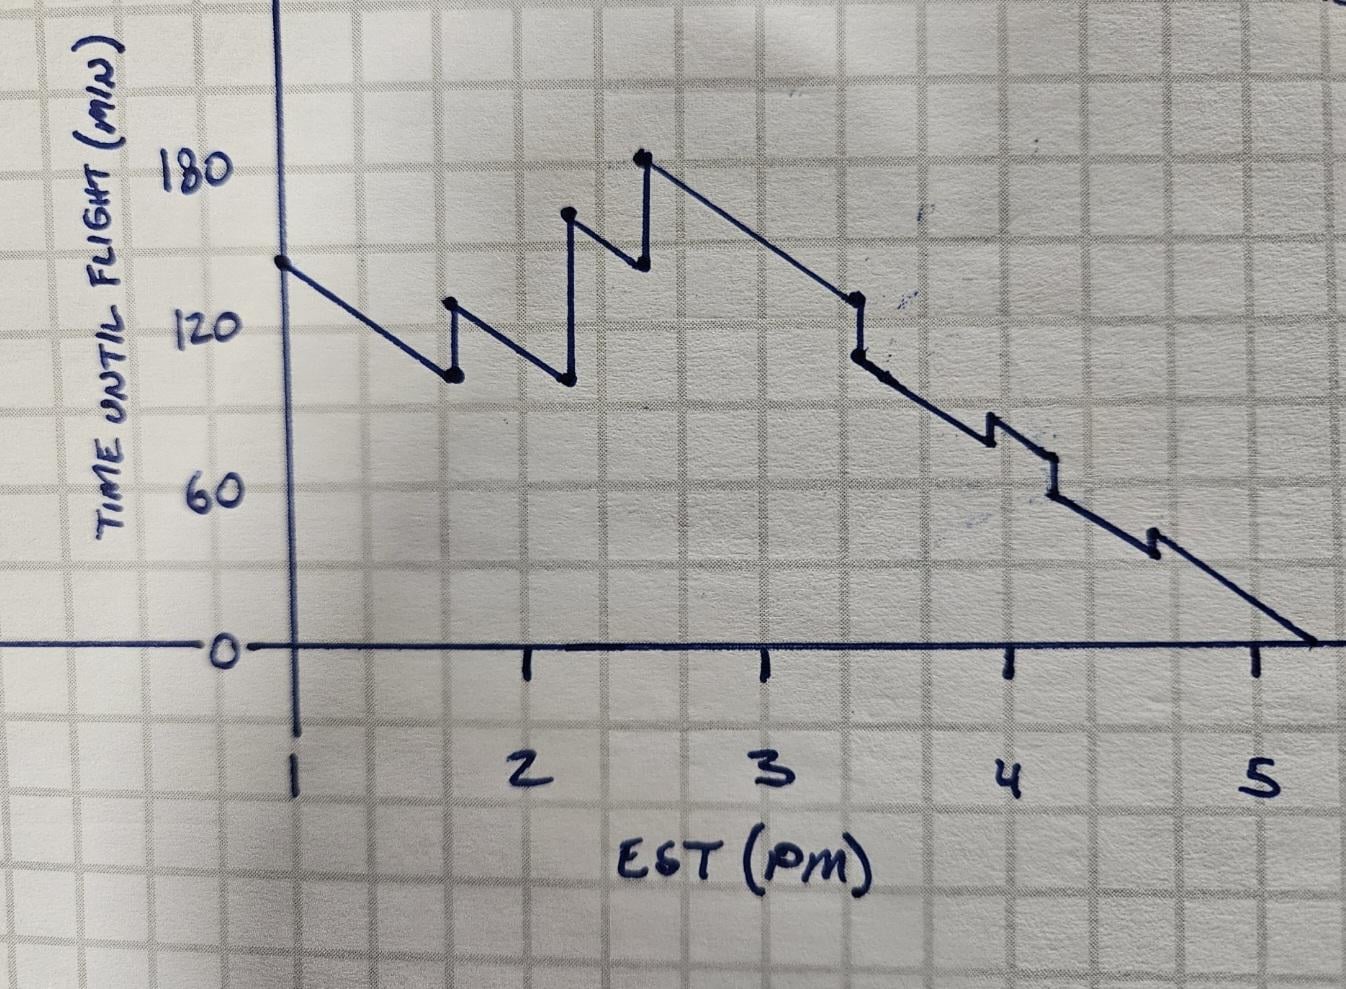
[OC] My flight this weekend was delayed 3 times, moved up, delayed, moved up, then delayed. I made a graph while waiting.
Posted by mkaku-
[OC] My flight this weekend was delayed 3 times, moved up, delayed, moved up, then delayed. I made a graph while waiting.
Posted by mkaku-
14 comments
over 3 hours should be an auto refund, no?
Cool. Breaks rule #5 of the sub, though.
For a moment, I thought this was the altitude of the International Space Station.
I’m showing this to my wife so she’ll quit making fun of me for making spreadsheets about everything.
Thanks for taking some of the heat, dude.
Why didn’t you use the same scale for horizontal and vertical time? (3 boxes horizontal/hr, 2 boxes vertical/hr)
Honestly this is more appropriate to “data is beautiful” than most of the absolute garbage on this sub.
Math question for my stupid brain. Has the AUC got any meaning with this graph?
*OP spraypainting a wall* *”Delayed, Delayed, Delayed”*
^(That sucks though, that happened to me earlier this year. I actually had bought flight insurance, which I usually never do and I was able to recoup my gas money for driving to the airport each time quickly for the delays.)
Ohmigod why are both axes, which are both Time, not coscalar. WTF is with 30 vs 40 min gridding? I’m’a need those drink coupons up off you, dog
Love the old school analogue approach. I went through stacks of graph paper doing plots in paleovisualization days…
Fascinating that the rate of change of ‘time until flight’ is constant throughout the day!
what kind of monster only has 3 ticks between each hour ? lol
Flight wait time (2024)
Gel Pen on paper
Best chart I’ve seen on here
Comments are closed.