**Tools:** Initial plotting using ChatGPT. Exported as an SVG and further design edits in Figma.
[removed]
Its a shame that the vast majority of this is set in the Global North. Where the infrastructure for this exists. Yet little to no funding exists or any infrastructure to support solar panel development.
Which has only been made worse due to inadequate funding of clean energy programs with predatory loans being sold to developing countries as “aid”.
Now calculate the carbon footprint of producing all those solar panels. /s
I’m not being contrarian, I just think it could be really telling because that’s basically what a lot of people do with a lot of positive things: plot the negative and ignore the positive.
And yet, some want to build coal and gas plants
This is interesting. What’s the reason for the sudden increase in the rate of solar panel installation?
Solar install rates have been doubling every other year since 2017, its great. They are expected to reach 3.5tw a year by 2030 and to continue on that path until about 2035. That implies solar by itself will push fossils out by around 2032.
“By 2030, the cumulative installed power (assuming 1 GW/day in 2024 ramping to 4 GW/day by 2028) would exceed global electricity use by approximately 198%, indicating a potential oversupply in installed capacity. ”
This is insane. In 5 short years this is possible
1.21 taking just over a day now.
The future.
X-axis is irregularly ticked, but…. it appears spacing is being used consistently so we’ll allow it. Really a nice job overall in demonstrating exponential (AKA constant percentage) growth (or decay as it were). In fact, that would be my only suggestion, to throw a best-fit exponential line on there that would end up looking linear on the semi-log plot you’ve chosen here.
Great plot. I went back to the source and saw a total worldwide installed capacity of 1400 GW. It is so little I can hardly believe it. To get a feeling, it corresponds to a single (large) nuclear reactor. Crazy. Good the increase looks exponential.
Even more telling when you add China to the graph where most of the change happened.
I got panels installed on my house in Minnesota a little over a year ago and I haven’t paid an energy bill in 10 months. I’m doing my part!
Just a shout-out to OurWorldInData. Such a great website!
Can anyone explain to me why the bureaucratic tyrants that run the energystar program still limit us to dishwashers that are ineffective when we have a growing amount of renewable energy and increasing share of energy demand going to unregulated consumption like AI data centers and crypto mining?
If crypto bros get whatever they want, the rest of us should be able to buy a decent dishwasher.
If battery prices and installs follow a similar trend we will be fossil fuel free by 2035-2038 without the need for any significant base load offset.
How long will it be before it takes an hour?
Edit: By about 2035 by my own rough estimate.
They’re harvesting free energy so our bills will go down. Right? RIGHT?!? …
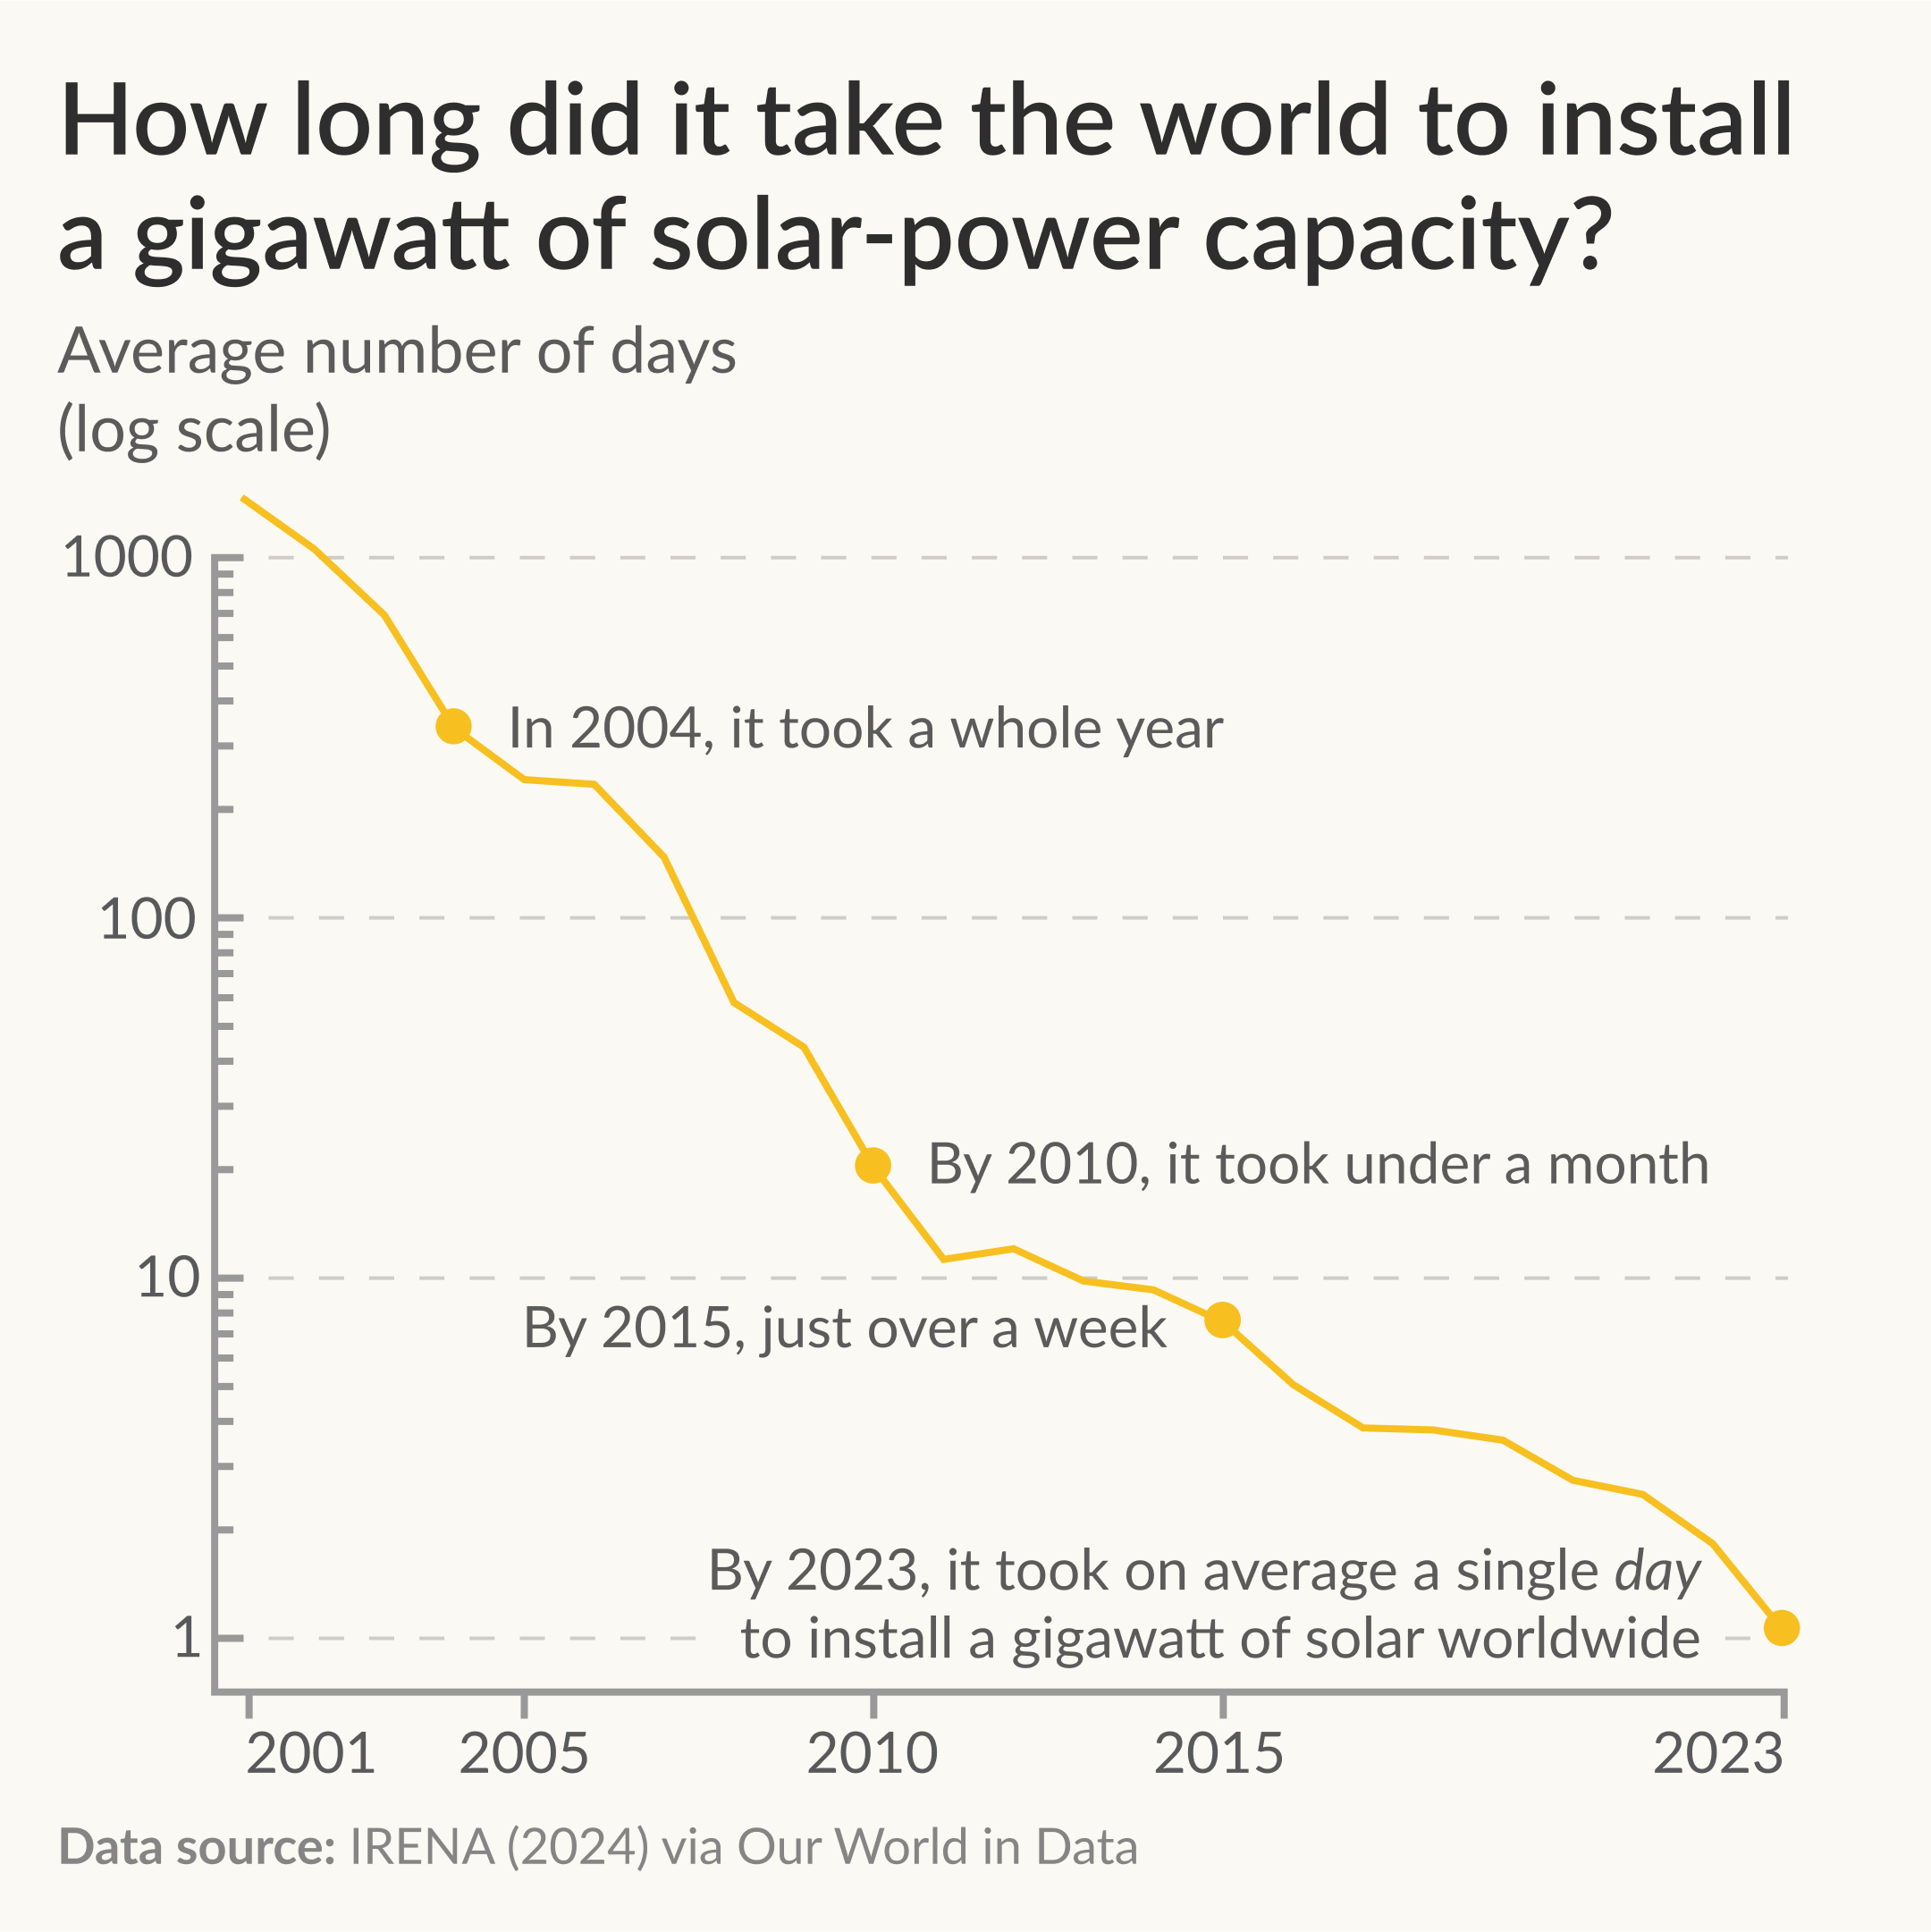
![[OC] How long did it take the world to install a gigawatt of solar-power capacity?](https://www.europesays.com/wp-content/uploads/2024/12/x6t7za5ah79e1-1920x1024.png)
18 comments
**Data source:** International Renewable Energy Agency (IRENA) (2024) via [Our World in Data](https://ourworldindata.org/grapher/installed-solar-pv-capacity?country=~OWID_WRL). My own calculations to convert that data into average number of days to install a gigawatt.
**Tools:** Initial plotting using ChatGPT. Exported as an SVG and further design edits in Figma.
[removed]
Its a shame that the vast majority of this is set in the Global North. Where the infrastructure for this exists. Yet little to no funding exists or any infrastructure to support solar panel development.
Which has only been made worse due to inadequate funding of clean energy programs with predatory loans being sold to developing countries as “aid”.
Now calculate the carbon footprint of producing all those solar panels. /s
I’m not being contrarian, I just think it could be really telling because that’s basically what a lot of people do with a lot of positive things: plot the negative and ignore the positive.
And yet, some want to build coal and gas plants
This is interesting. What’s the reason for the sudden increase in the rate of solar panel installation?
Solar install rates have been doubling every other year since 2017, its great. They are expected to reach 3.5tw a year by 2030 and to continue on that path until about 2035. That implies solar by itself will push fossils out by around 2032.
“By 2030, the cumulative installed power (assuming 1 GW/day in 2024 ramping to 4 GW/day by 2028) would exceed global electricity use by approximately 198%, indicating a potential oversupply in installed capacity. ”
This is insane. In 5 short years this is possible
1.21 taking just over a day now.
The future.
X-axis is irregularly ticked, but…. it appears spacing is being used consistently so we’ll allow it. Really a nice job overall in demonstrating exponential (AKA constant percentage) growth (or decay as it were). In fact, that would be my only suggestion, to throw a best-fit exponential line on there that would end up looking linear on the semi-log plot you’ve chosen here.
Great plot. I went back to the source and saw a total worldwide installed capacity of 1400 GW. It is so little I can hardly believe it. To get a feeling, it corresponds to a single (large) nuclear reactor. Crazy. Good the increase looks exponential.
Even more telling when you add China to the graph where most of the change happened.
I got panels installed on my house in Minnesota a little over a year ago and I haven’t paid an energy bill in 10 months. I’m doing my part!
Just a shout-out to OurWorldInData. Such a great website!
Can anyone explain to me why the bureaucratic tyrants that run the energystar program still limit us to dishwashers that are ineffective when we have a growing amount of renewable energy and increasing share of energy demand going to unregulated consumption like AI data centers and crypto mining?
If crypto bros get whatever they want, the rest of us should be able to buy a decent dishwasher.
If battery prices and installs follow a similar trend we will be fossil fuel free by 2035-2038 without the need for any significant base load offset.
How long will it be before it takes an hour?
Edit: By about 2035 by my own rough estimate.
They’re harvesting free energy so our bills will go down. Right? RIGHT?!? …
Comments are closed.