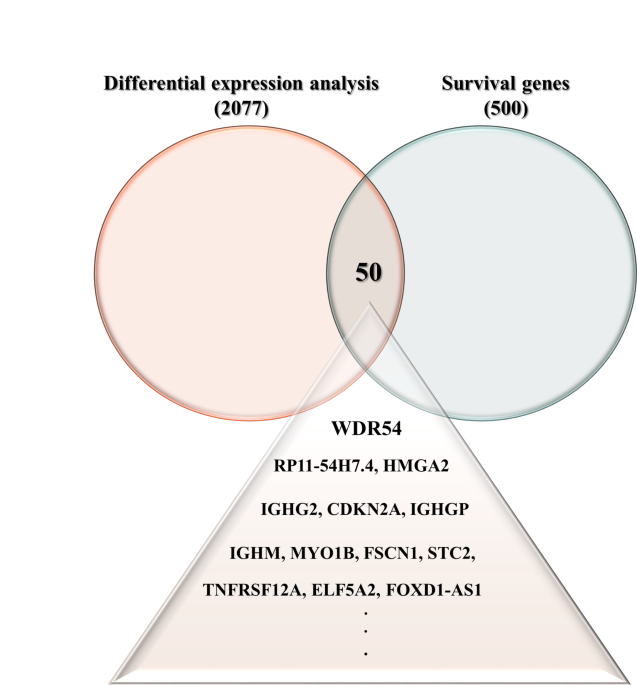
We used GEPIA2 to search for genes that were commonly expressed as part of the survival-related gene category (n = 500) and genes that were differentially expressed (n = 2077) between normal and HNSCC tumor tissues using the prostate adenocarcinoma (TCGA-PRAD) and Genotype-Tissue Expression (GTEx) datasets accessed from the Cancer Genome Atlas. We identified 50 genes that were commonly overexpressed in both differential expression and survival analyses of HNSCC. We selected WDR54 and analyzed the effect on HNSCC (Fig. 1). Using the GEPIA2 database, we compared 44 normal and 519 tumor samples. WDR54 was overexpressed in most tumors compared to that in normal tissues, particularly lymphoid neoplasm diffuse large B cell lymphoma (DLBC), esophageal carcinoma (ESCA), kidney chromophobe (KIRC), kidney renal clear cell carcinoma (KIRP), pancreatic adenocarcinoma (PAAD), skin cutaneous melanoma (SKCM), thymoma (THYM), and head and neck squamous cell carcinoma (HNSC) (Fig. 2A). A comparison of WDR54 mRNA expression in 44 normal and 519 HNSCC tumor tissues revealed significant overexpression in tumor tissues (Fig. 2B). Especially, the expression level of WDR54 was significantly higher in the HNSCC tumors compared with matched normal tissues (Fig. 2C). We used the GSE58911, GSE178537, and GSE33232 datasets to analyze WDR54 expression and observed that it was significantly elevated in tumors compared to that in normal samples in all three analyses (Fig. 2D).

Intersection of differentially expressed and survival genes in HNSCC. (A) To identify key genes associated with HNSCC, we utilized GEPIA2 to intersect the results of a differential expression analysis (n = 2077) and a survival gene analysis (n = 500). We identified 50 genes that were commonly overexpressed in HNSCC, including WDR54.
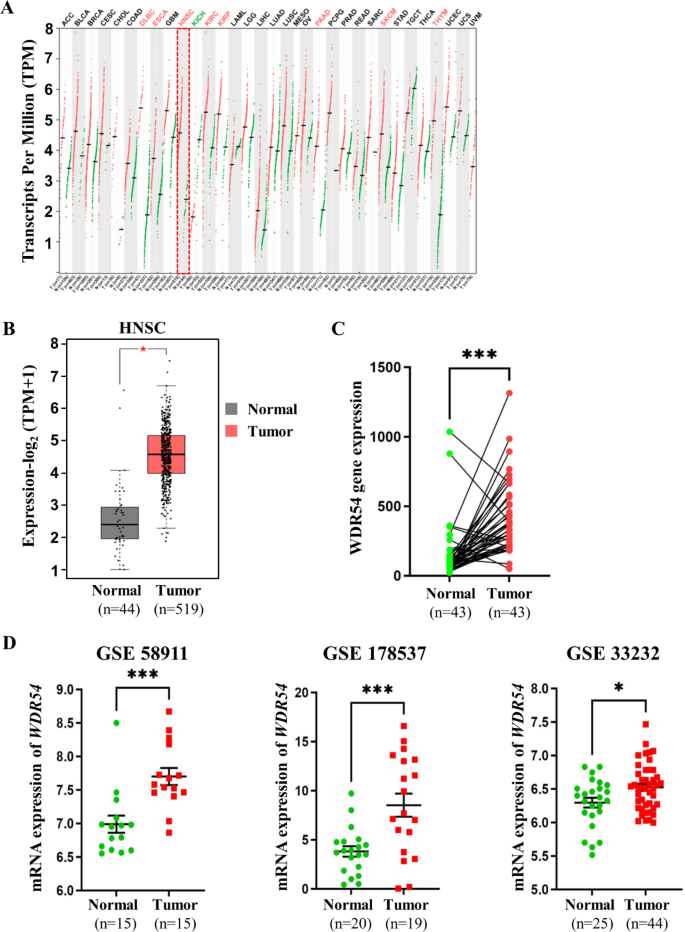
Expression of WDR54 in HNSCC. (A) Gene expression levels of WDR54 in 33 cancer types using GEPIA2, comparing cancerous (red) and normal (green) tissues. (B) Comparison of WDR54 expression in normal (gray) and HNSCC tumor (red) samples using the GEPIA2. *p C) Paired samples comparison for the expression levels of WDR54 in 44 pairs of HNSCC tissues and matched normal tissues. ***p D) Comparison of WDR54 expression in normal and tumor samples using the GSE58911, GSE178537, and GSE33232 datasets. * p p
WDR54 levels and clinical characteristics of patients with HNSCC
We have identified that WDR54 is overexpressed in HNSCC and analyzed whether there is a difference in WDR54 expression among different pathological stages using the online UALCAN database. WDR54 levels were observed to increase with cancer stage (stages 1, 2, 3, and 4) in patients with HNSCC compared to those in normal tissues (Fig. 3A). WDR54 expression was higher in HNSCC tissues classified as cancer stages 1, 2, 3, and 4 than that in normal tissues (Fig. 3B). In the case of nodal metastasis, the expression of WDR54 at all stages (N0, N1, N2, and N3) was higher than that in normal tissues (Fig. 3C).
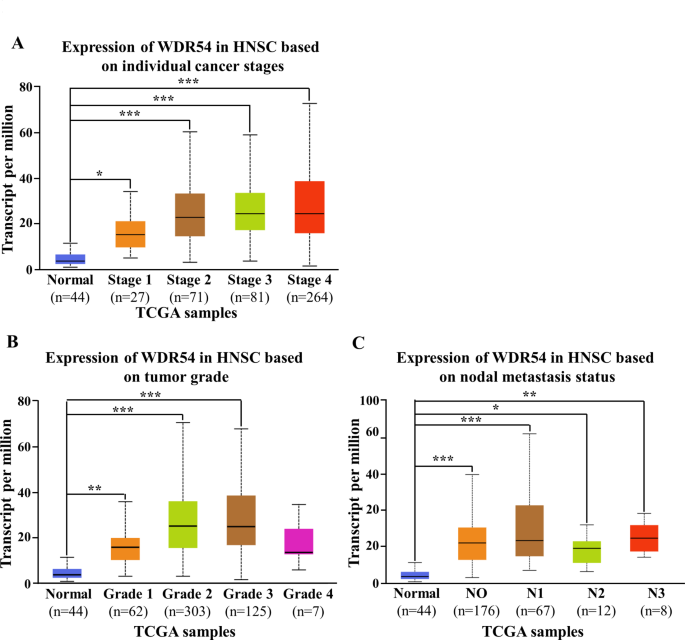
Analysis of WDR54 expression in patients with HNSCC and clinical characteristics using the UALCAN database. WDR54 expression in HNSCC according to (A) individual cancer stage, (B) tumor grade, and (C) nodal metastasis status. * p p p
WDR54 expression in HNSCC metastasis
We performed an RNA-seq-based TNM plot analysis to compare normal samples with metastatic patient samples to predict whether WDR54 could influence metastasis. We observed that WDR54 expression was further increased in metastatic patient samples compared to that in normal samples (Fig. 4A). Additionally, we analyzed WDR54 expression using several GEO datasets (GSE178537, GSE117753, and GSE67614) and observed that metastatic samples had significantly higher WDR54 levels than that in normal and tumor samples (Fig. 4B).
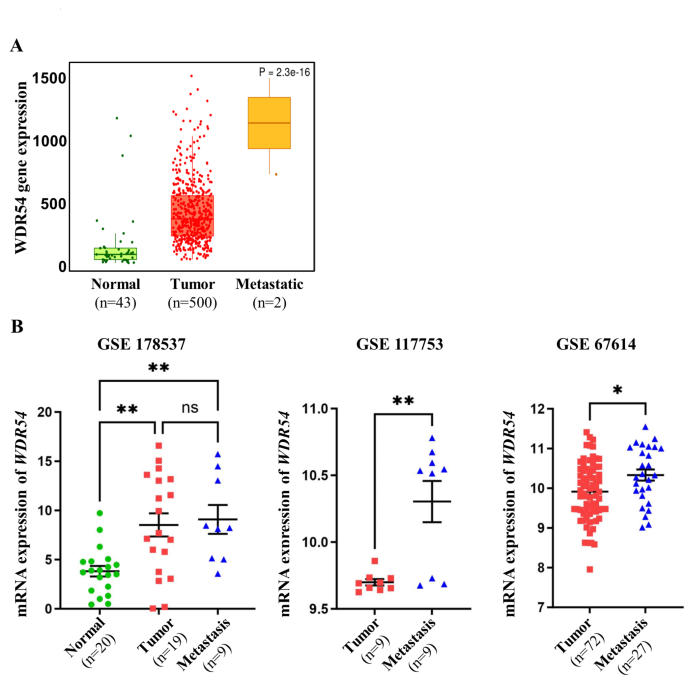
Analysis of WDR54 expression in normal, tumor, and metastasis of HNSCC. (A) Comparison of WDR54 expression in normal, tumor, and metastatic samples of patients with HNSCC from the TNMplot database. (B) Analysis of WDR54 expression in normal (green circle), tumor (red square), and metastatic samples (blue triangles) from the GSE178537, GSE117753, and GSE67614 datasets. * p p
Prognostic value of WDR54 levels in HNSCC
To further clarify the relationship between WDR54 expression and the prognosis of patients with HNSCC, we used the GEPIA2 database and Kaplan–Meier survival curve analysis. Using a survival map from the GEPIA2 database, we analyzed the expression of genes in various cancer types and observed that increased WDR54 expression was associated with poor survival in patients with adrenocortical carcinoma, acute myeloid leukemia, liver hepatocellular carcinoma, mesothelioma, uveal melanoma, and HNSCC (Fig. 5A).
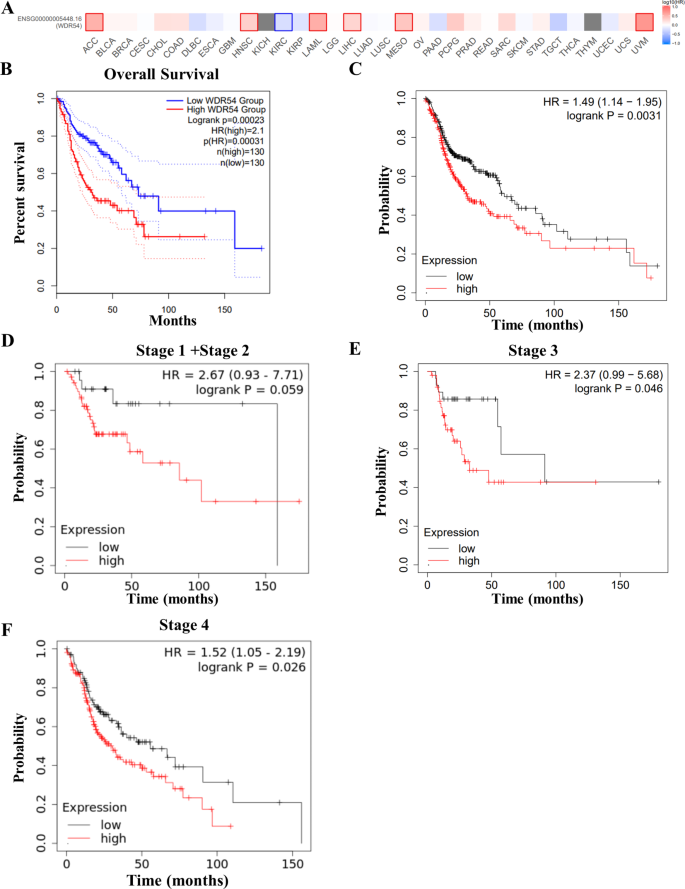
Impact of WDR54 expression on survival in HNSCC. (A–B) Analysis of overall survival in various cancers based on WDR54 expression and overall survival analysis in HNSCC using the GEPIA2 statistical analysis web server. Overall survival data analysis was performed using the log-rank test, and patients were divided into high-risk and low-risk groups based on the quartile cutoff (Cutoff-High : 75%, Cutoff-Low : 25%). (C–F) Survival analysis of overall patients and stage-specific survival based on WDR54 expression in patients with HNSCC using Kaplan–Meier analysis.
An overall survival graph obtained using the GEPIA2 database confirmed that WDR54 overexpression was associated with poor survival (p = 0.00023, hazard ratio [HR] (high) = 2.1, p (HR) = 0.00031) (Fig. 5B). Similar to the GEPIA2 database, the Kaplan–Meier plotter analysis showed that patients with high WDR54 expression had lower survival rates, with a median overall survival of 61.27 months for WDR54 low expression and 32.83 months for WDR54 high expression (p = 0.0031, HR = 1.49) (Fig. 5C). We analyzed the survival rates according to tumor stage and WDR54 levels. When we checked by pathological stage, we observed that a high WDR54 level was associated with poor survival in stages 1 + 2, 3, and 4 (Fig. 5D and F). Although the results were not significant when stages 1 and 2 were examined separately, high WDR54 levels were associated with poor survival (data not shown).
Patients with high WDR54 levels had lower survival rates than those with low WDR54 levels at all stages. The survival rates decreased gradually with high WDR54 levels at various tumor stages, progressing from 85.67 months for stage 1 + 2 (p = 0.059, HR = 2.67), to 32.83 months for stage 3 (p = 0.046, HR = 2.37), and finally declining to 30.5 months for stage 4 (p = 0.026, HR = 1.52). When analyzed by sex, both men and women with higher WDR54 levels had lower survival rates (Supplementary Fig. S1A, S1B). Survival rates were 35.97 months for men and 25.43 months for women with high WDR54 levels.
We observed a significant correlation between WDR54 expression and the immune subtype in HNSCC. We performed a Kaplan–Meier survival analysis by stratifying the active immune subtypes. Patients with high WDR54 levels had a poor prognosis, regardless of whether they had enriched or decreased levels of macrophages, natural killer T cells, CD4 + memory T cells, or CD8 + T cells (Fig. 6 and Supplementary Fig. S2).
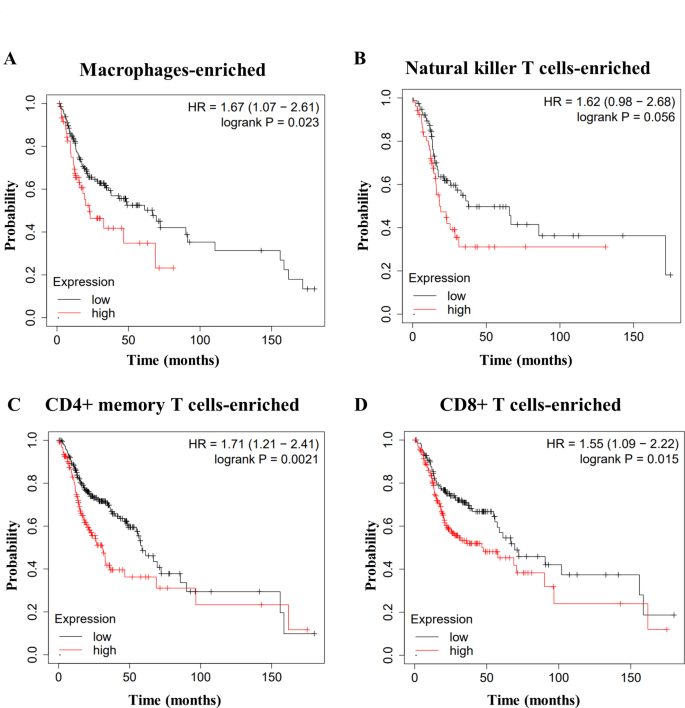
Kaplan–Meier survival analysis based on different immune subtypes of HNSCC. Survival analysis based on WDR54 expression in different immune subtypes of HNSCC: (A) macrophage-enriched, (B) natural killer T cell-enriched, (C) CD4 + memory T cell-enriched, and (D) CD8 + T cell-enriched.
Correlation between WDR54 and epidermal growth factor receptor (EGFR) expression
We used the GEPIA2 online tool to analyze the correlation between the human EGFR and WDR54 proteins, which are target biomarkers for head and neck cancer and various other cancers. We observed that both genes were overexpressed in tumors compared to those in normal tissues in the DLBS, ESCA, GBM, KIRC, KIRP, LGG, LUSC, PAAD, STAD, THYM, and HNSCC gene expression datasets. (Fig. 7A). Moreover, WDR54 expression was positively correlated with EGFR expression in HNSCC (Fig. 7B). We further examined the expression of WDR54 and EGFR using two different GEO datasets (GSE58911 and GSE178537). Both datasets indicated that WDR54 expression was significantly correlated with EGFR expression (Fig. 7C).
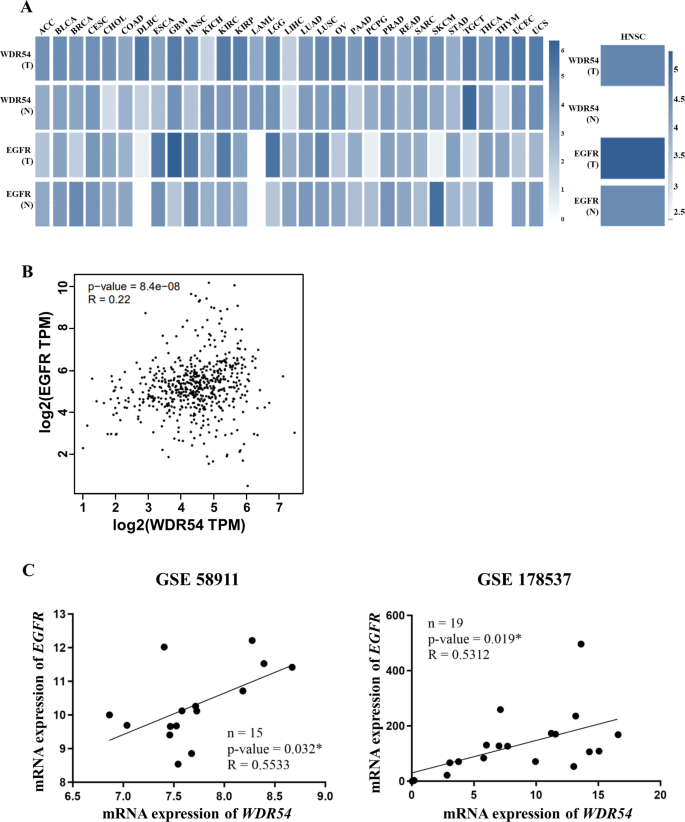
Correlation analysis of EGFR and WDR54 in HNSCC. (A) Expression relationship analysis of EGFR and WDR54 in various cancers. Expression levels of EGFR and WDR54 are represented by white for low expression and blue for high expression. (B–C) Correlation between EGFR and WDR54 expression in HNSCC using GEPIA2 and gene expression omnibus datasets GSE58911 (Fig. 7C left panel) and GSE178537 (Fig. 7C right panel). The Spearman correlation coefficient was used, and EGFR and WDR54 showed a positive correlation.
Analyzing the therapeutic target potential of WDR54 in HNSCC cell
To assess the therapeutic target potential of WDR54 in HNSCC, we employed siRNA to reduce the expression of WDR54 in FaDu cell (Fig. 8A). WDR54-downregulated FaDu cell decreased proliferation (Fig. 8B). We treated WDR54-downregulated FaDu cell with varying concentrations of the commonly used chemotherapeutic agents for HNSCC, cisplatin and 5-fluorouracil, to assess their cell viability. The results showed that WDR54- downregulated FaDu cell exhibited increased sensitivity to cisplatin and 5-fluorouracil (Fig. 8C–D). This suggests that WDR54 may serve as a novel therapeutic target for HNSCC.
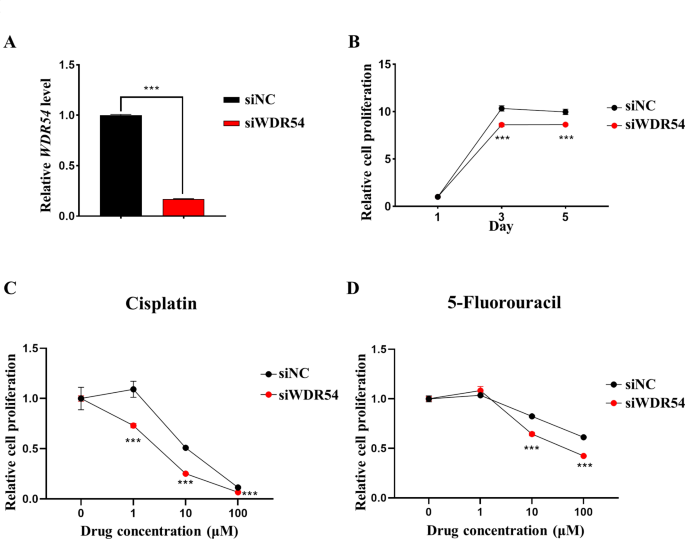
Analysis of the Therapeutic Targeting Potential of WDR54 in HNSCC cell FaDu. (A) mRNA expression level of WDR54 in WDR54-knockdown FaDu cell. (B) Cell proliferation was analyzed in WDR54-knockdown FaDu cell. (B–C) Analysis of cell viability of Cisplatin (B) and 5-Fluorouracil (C) in HNSCC cell FaDu with downregulated WDR54.***p