Besides a great quarterback and head coach/offensive play caller, there is nothing like having a dominant defensive lineman in the NFL. Often the straw that stirs the drink, dominating defensive tackles and ends make life easier on every other position on the defense.
The Cleveland Browns have one in DE Myles Garrett who won the Defensive Player of the Year award last season. When it became known that Garrett was winning, Pittsburgh Steelers OLB TJ Watt decided not to attend the ceremony because he felt like he should have won.
Garrett and Watt top some of the advanced metrics for impact defensive linemen (even if Watt is technically a linebacker). Heading into the final week of the 2024 regular season, neither sits atop the odds to be named this year’s DPOY. That honor currently goes to Denver Broncos CB Patrick Surtain II (-250).
Watt (+190) is second with Garrett (+1800) a long shot in fourth place.
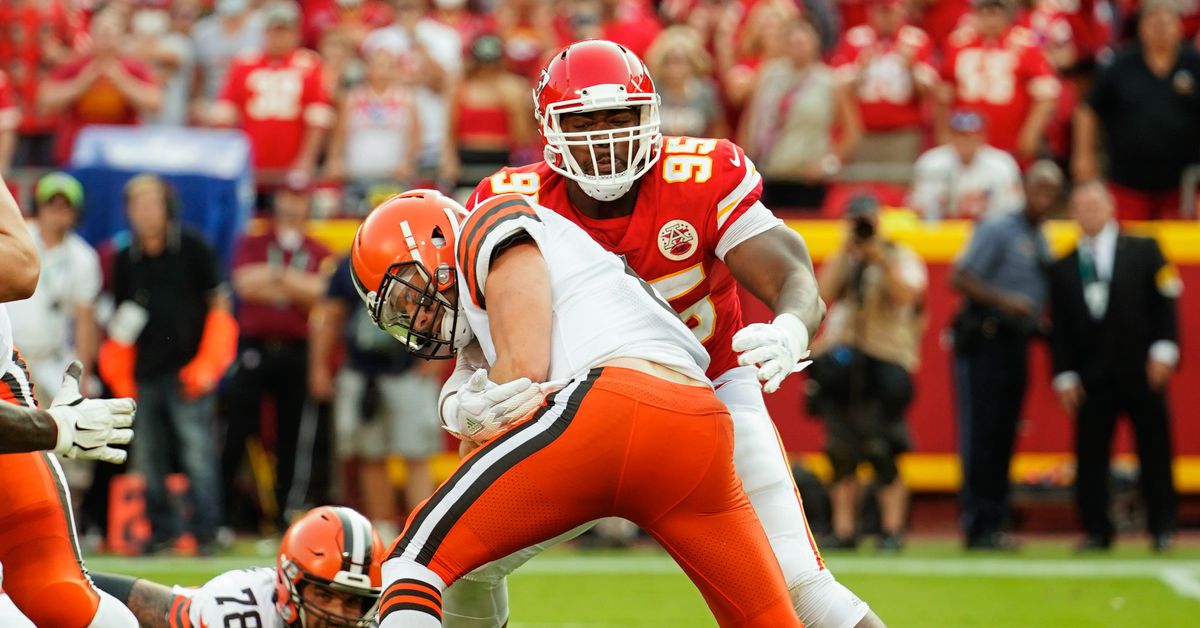
What we can all agree on is that Watt and Garrett, along with DT Chris Jones (pictured above), are among the best defenders in the league. The following chart attempts to put a number of those players against each other in stats, metrics and grades to provide perspective on the seasons each defensive lineman is having:
With there being so many numbers, we extracted those of Garrett, Watts and Jones in the chart below to make the reading easier:
Disruption Rates
Stat/Data Point
Myles Garrett
TJ Watt
Chris Jones
Stat/Data Point
Myles Garrett
TJ Watt
Chris Jones
Run Defense Snaps
303
316
224
TFL (non-sacks)
8
9
6
Stops (PFF)
33
39
22
Stop %
4.40%
4.60%
2.90%
Run Stop %
5.40%
7.80%
6.90%
Forced Fumbles
3
6
1
Fumble Recoveries
1
2
0
INTs
0
0
0
PDs
1
4
0
TDs
0
0
0
Pass rush snaps
449
537
545
Total Pressures (PFF)
79
47
74
Pressure Rate
17.60%
8.8%%
13.60%
Sacks (PFF)
14
12
6
Sack Rate
3.10%
2.2%%
1.10%
QB Hits (PFF)
13
16
15
QB Hit Rate
2.90%
3.0%%
2.80%
Hurries
52
19
53
Hurry Rate
11.60%
3.5%%
9.70%
PFF Grade
92.7
92
89.7
PFF Run Defense Grade
78.5
91.6
64.3
PFF Pass Rush Grade
93.2
88.4
91
Pass-Rush Productivity
10.2
6.3
7.9
PFF Win Rate %
24.40%
13.70%
18.10%
PFF TPS Rush Grade
92.8
90.3
91.4
True Pass Sets Productivity
17.9
8.6
12.1
True Pass Sets Win %
33.30%
16.00%
24.60%
Expected Sack Total
18.8
11.2
17.6
Expected Actual Sacks
4.8
-0.8
11.6
PFF Doubled/Chip Rate %
45%
44%
72%
Double Team Grade over Expected
0.12
-0.005
N/A for DTs
ESPN Double Team Rate
29%
14%
72%
ESPN Pass Rush Win Rate %
22%
19%
20%
ESPN Pressure Rate
14%
7%
12%
Thorn’s Total Pressures Count
65
35
69
Thorn’s True Pressure Rate Score
55.8
25.8
59.3
Rare & High Quality Pressures
41
16
48
Thorn’s Snaps/Pressure
6.5
14.2
7.4
Thorn’s Snaps/HQ pressure
10.1
31.1
10.6
Thorn’s Pressure Quality Ratio
1.72
0.86
2.32
Impact Score
222
171
184
Impact Rate
29.50%
20.00%
23.90%
Disruption Rate
31.00%
18.20%
25.00%
Avg. Double/Chip Rate
27.00%
29.00%
72.00%
Adjusted Disruptoin Rate
34.80%
19.40%
34.30%
While that is still a lot of data, you can get a good overview by looking at the color distribution on the full chart above and then focusing on the last five specific data points that summarize some of the data above it.
What we see is the most disruptive player of the group and Watt, by far, is the least disruptive. Providing data points from multiple sources helps give credence to the final information on the bottom as well as compare each player on each point.
While DPOY is not decided by data points, and instead by voters, it is interesting to look at some of the best defensive linemen in the NFL lined up next to each other. Surtain, the favorite for the award, is a unique talent to possibly beat out these type of linemen.
Are you surprised at what the data says pretty much across the board about Garrett and Watt? Why do you think Watt’s reputation is better than his data suggests it should be?