
Softbank CEO Masayoshi Son famously said “Those who rule data will rule the entire world.” He was talking about computer chips but might as well have been referring to integrated assessment models (IAMs) used in climate science and policy.
A new paper — van de Ven et al. 2024 or vdV24 — analyzes thousands of climate scenarios produced by IAM modeling groups over the past three decades as the basis for three recent IPCC reports (AR5 2013/2014, SR1.5 2018, AR6 2021/2022). Today I summarize the significance of the data collected by vdV24 for understanding important biases in climate research.
Specifically, the new paper provides insight into how Europe — with less than 10% of global population and about 15% of global GDP — has come to quietly dominate climate science and policy. It turns out that IAMs are an incredibly important base of soft power. Let’s have a look.
IAMs are useful for producing scenarios of alternative futures that integrate a large number of assumptions and dynamics. These scenarios include projections of future carbon dioxide (and other) emissions that are used as inputs to further modeling efforts.
In a companion commentary to vdV24, Burgess and Dancer 2024 explain why such scenarios are so important:
It is difficult to overstate the influence of emissions scenarios, especially the few marker scenarios prioritized by international climate modelling efforts and the IPCC1,2. This handful of prioritized scenarios underpins global and regional projections of climate impacts1,2, United Nations deliberations on how much rich countries owe to poorer countries for climate damages2, and many private climate analytics products, which guide mitigation and adaptation decisions by banks, insurance companies and other parts of the private sector3.
European institutions and funding is the basis for most integrated assessment modeling — vdV24 explain:
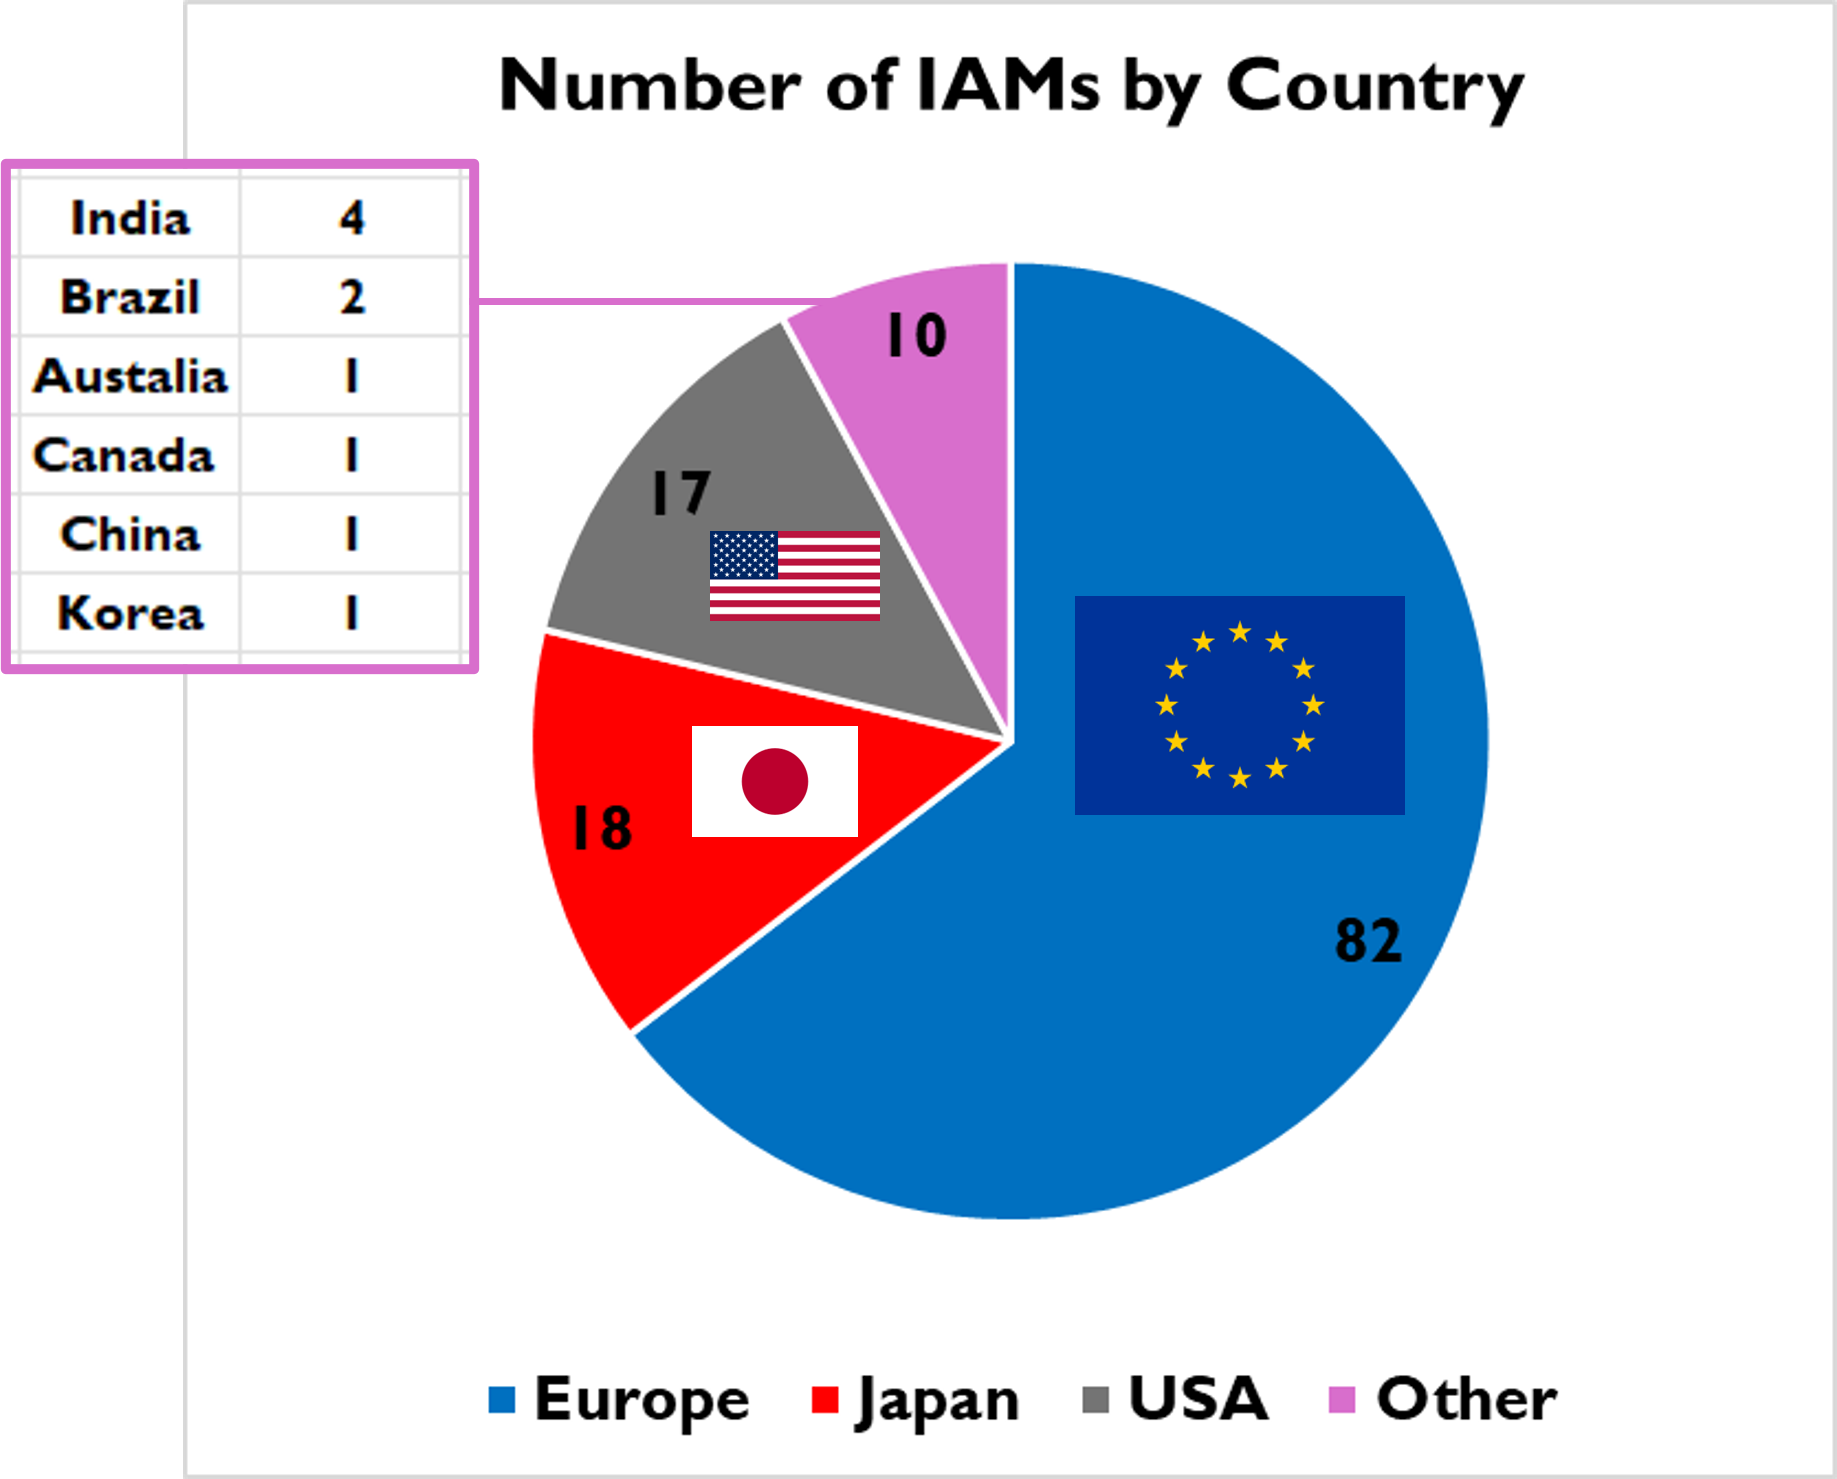
European scenario developers have contributed most scenarios to the examined reports (71% in AR6, 75% in SR1.5 and 66% in AR5), so they expectedly have a large impact on the overall patterns in the IPCC scenario databases.
The figure below shows the overwhelming role of European institutions in developing and hosting IAMs. More IAMs means more groups doing IAM research, more papers published in the literature, a greater role for that research in scientific assessments, and more opportunities to extend the reach of IAMs beyond climate science and into settings like banking and finance, corporate governance, and a wide range of government policy making.
Why might it matter that most climate scenarios come from Europe-based IAMs?
Simple — because IAMs are so crucial to earth system modeling, projections of climate impacts, options for and economics of mitigation, and so on. Consequently, those who produce IAMs have an outsized, and largely out-of-sight, role in climate science and policy.
For example, the figure below — excerpted from the vdV24 SI — shows that in the AR6 scenarios originating in Europe have wind and solar playing a 2.5x greater role in global energy in 2050 than do scenarios originating outside Europe (left panel). Similarly, nuclear energy in 2050 has half the role in European AR6 scenarios compared to those from outside Europe (right panel).
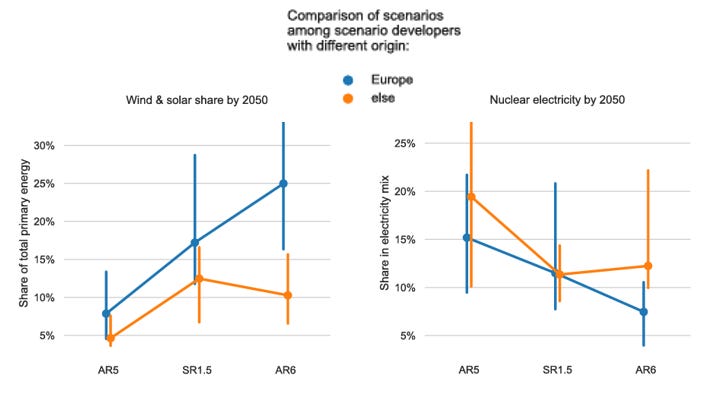
You can also see in the figure above that from 2018 (SR1.5) to 2022 (AR6) IA modelers outside of Europe became more pessimistic about the role of wind and solar and more optimistic about nuclear. The European modelers moved in the opposite direction.
Because of the dominance of European IAMs, aggregated statistics of scenarios show preferences for wind and solar and disfavor nuclear. It would be easy to conclude that this outcome is a result of technological or economic dynamics of the real world as processed through sophisticated models.
Instead, such results may simply reflect European values and biases, baked into the fabric of individual IAMs, which have so much complexity that it is difficult for independent observers to tease out how values and politics might influence assumptions and model construction.
vdV24 explain why European IAMs may exhibit preferences for solar and wind:
[N]arratives stemming from a European context may be more pro-renewables given the rapid roll-out of solar and wind envisioned in the European Green Deal. and, perhaps, the EU being a major funder of such studies (for example, via H2020 and Horizon Europe). The dominance of scenarios from European institutes in scenario ensembles may explain the increased focus on VRE [variable renewables] in more recent scenario ensembles. European narratives may, however, contrast with narratives from developing economies, such as India, where mitigation strategies are interwoven with socioeconomic development.
Other research research reinforces these conclusions. For instance, an important 2024 paper — Kanitkar et al. — finds that IPCC AR6 scenarios project growing economic inequities between countries that are rich today and those that are poor. They observe the uncomfortable fact that almost all IPCC scenarios that project growing inequities are produced in rich parts of the world.
A few other technical points about vdV24:
First, vdV24 confirms our 2008 analysis of the IPCC SRES scenarios — Specifically, Chris Green, Tom Wigley and I argued that the SRES scenarios were overall too aggressive in their assumptions of decreases of energy intensity and carbon intensity in the absence of specific policies, what we called “spontaneous decarbonization.” vdV24 explain:
[R]elative to AR5 and AR6, SRES projected significantly higher gross domestic product (GDP) growth, but also stronger decline in energy intensity of GDP and CO2 intensity of energy, even in the absence of policy.
Second, IAMs are plastic enough to produce results that make climate policy success appear feasible even as emissions have not decreased and targets have become more stringent. That odd result suggests something amiss in projections. vdV24 explain:
Since 2010, remaining carbon budgets have shrunk by ~400 GtCO2 (~0.5 °C), yet the achievability and macroeconomic implications of delivering the same climate target have not markedly changed. An important interpretation of this is that AR5 portrayed more ambitious climate action as harder and costlier than nowadays calculated.
Third, vdV24 highlight a point we have often made — Climate scenarios desperately need to be kept up-to-date. The climate community only updates scenarios about once a decade as scholars use fixed scenarios for research that spans entire careers. Consider that since January 1, 2024 more than 3,200 studies have been published using the “representative concentration pathway” scenarios developed starting in 2005 — Good for academic CVs and citation counts but far removed from 2025. vdV24 explain:
The deviation between projected and observed trends in many key technologies points to the need for sustained effort to further update models. Any failure by IPCC scenarios to adequately reflect the practicability/plausibility of certain changes becomes more significant with declining carbon budgets. It is, therefore, important that modelling communities work closely with stakeholders to keep their critical technology assumptions up-to-date amidst rapidly evolving market dynamics.
Fourth, the plasticity of IAMs means that they can be used to produce results showing that practically unrealistic targets can still be met in a model. Instead, as Erica Thompson has wisely recommended — we need to escape from model land. vdV24 explain:
It is likely that the 1.5 °C temperature stabilization goal will be exceeded within the next 5–10 years49, dictating a reframing of scenarios and IAMs. Instead of more elaborate ways to keep below 1.5 °C, focus may shift towards feasibility50, requiring more critical thinking on how different technologies may be deployed under different policy and regional contexts. This emphasizes the importance of using multiple streams of evidence when using/interpreting scenarios, such as sectoral and national expertise. Models and scenarios are enticing because of their ability to integrate hundreds or thousands of assumptions, but this also makes them susceptible to providing a false sense of confidence in results.
Once again, we see that the climate research community faces serious challenges when it comes to scenarios which are out-of-date, geographically biased, perpetuate inequities, and under the narrow control of a small group of scholars. Fixing this problem will require a commitment to significant institutional innovation that will necessarily have winners and losers — Strong leadership is therefore essential. Fortunately, the IPCC has a model to draw upon in its SRES 2000 exercise.
The easiest thing you can do to support THB is to click that “♡ Like”. More likes mean the higher this post rises in Substack feeds and then THB gets in front of more readers!
It is not too late to get in your 2025 predictions! Thanks for reading! THB is reader supported, which means I work for you — Literally. I like it that way. You can find a readily accessible list of THB series here. THB is largely open access thanks to paid subscribers who have told me that they support my work so it can be available to all — Even so, in 2024, about 15% of posts included paid-subscriber only content. So click that subscribe button!