[Noozhawk’s note: Third in a series. Click here for the first article, and click here for the second.]
In Part II of this series, we did a Reader’s Digest view of the multiple natural phenomenons that keep our planet alive and has produced over the last couple of hundred thousand years the opportunity for us Homo sapiens to grow into “modern man” exist because of warmer climates.
But now we have to acknowledge that the last 200 years, with the evolution of the Industrial Age, fossil fuels are the major sources of our world’s energy, and at the same time our earth has warmed 2.7 degrees.
That needs to be better understood.
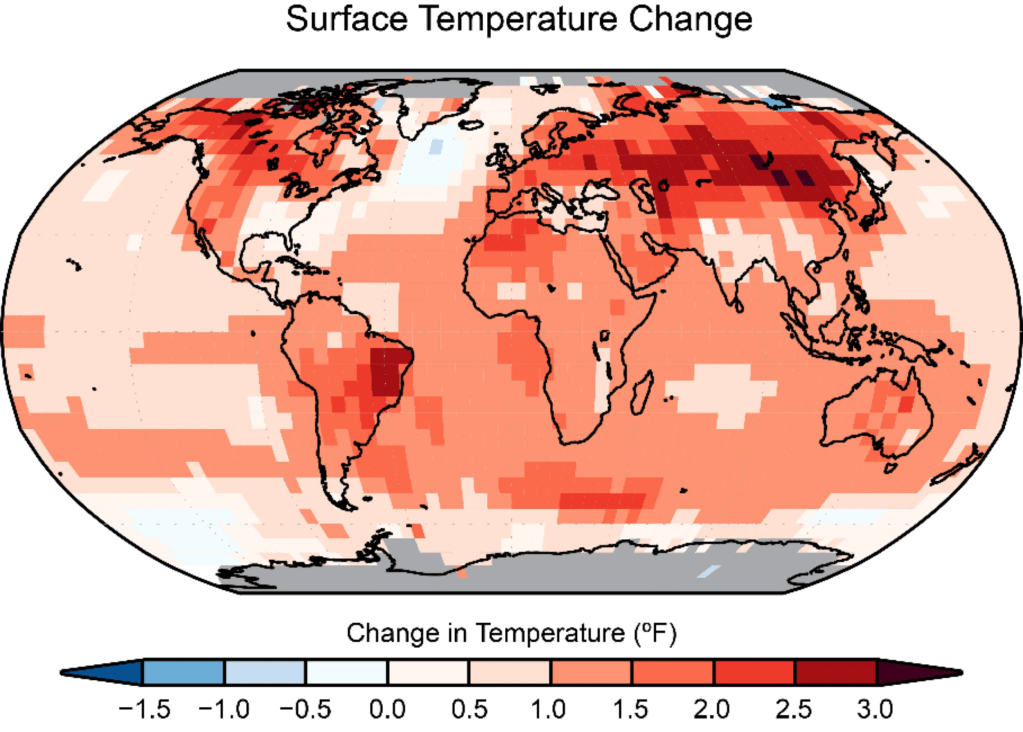
But, is our planet’s temperature rising the same (land and sea)? A U.S. Global Change Research Program study was published calculating the temperature change for the period 1986-2015 relative to 1901-1960 over populated (urban) regions, and less so in more sparsely populated land and oceans.
 Credit: U.S. Global Change Research Program Fourth National Climate Assessment illustration
What we do know, even though it’s suppressed in reporting, is that warming in the last couple of decades is not uniform (i.e. globally spread).
The largest variations of warming are centered in large population centers with concentrated environments known as Urban Heat Islands. This continued error in “global” warming reporting needs to see the light of day.
So, it’s not clear as the balls and strikes the U.N. Intergovernmental Panel on Climate Change’s core writing team members present in the Synthesis Report and what is reported by the news media.
Moving on …
Coal was the first and largest energy source until most industrial nations better understood the consequences of emission, pollution and toxins with health issue consequences.
The United States began reducing coal product in the early 2000s, replacing this fuel source mostly with more natural gas.
Natural gas produces 50% less CO₂ per megawatt-hour, and 20% less emissions versus gas in transportation per the U.S. Energy Information Administration (our MarBorg Industries vehicles are powered by natural gas, by the way).
Unfortunately, coal continues to grow in demand throughout the world, especially China. The chart below illustrates the use of coal by major players throughout the world.
And as you can see, the United States started reducing our coal production in the early 2000s, primarily replacing with it with natural gas, which is both a cheaper, cleaner energy source and has lower emissions.
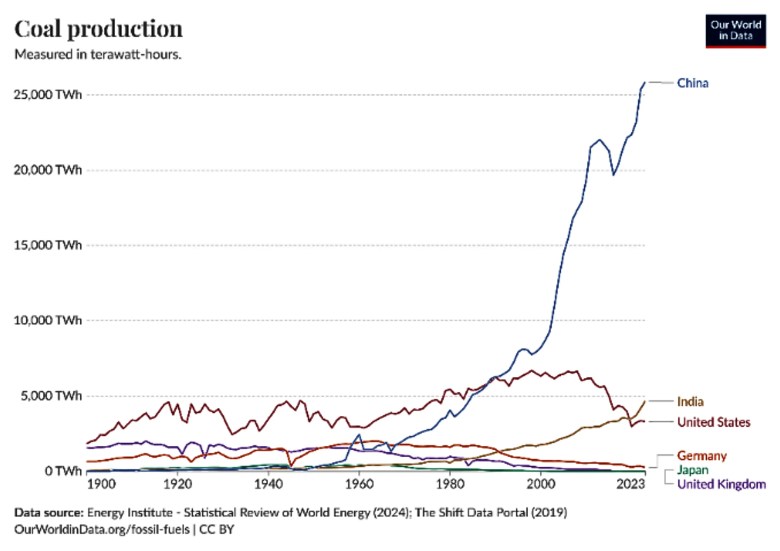 Credit: Our World in Data illustration
But what’s rarely reported is the level of natural CO₂ emissions annually versus man-made emissions. To put it into perspective, the total annual CO₂ emission into the atmosphere today is ~750 gigatons (GT) of which ~40 GT is man-made (~5%)!
The United States’ 5.3 GT is the same today as emissions in 1990, contributing less than 1% annually to the global total.
Before we leave greenhouse gas emissions, it must be acknowledged that, unlike clouds, ~60% of CO₂ remains in our atmosphere for 20 years, ~30% for a century.
The other important human influence for warming is methane (CH₄), both a byproduct of natural gas and many other sources.
One of its outgases is methane emissions, which are also increasing in our atmosphere for several reasons that also need a deeper dive.
Globally, methane emissions are ~580 million metric tons (Mt) per year, with ~40% coming from natural sources and ~60% from human activity (anthropogenic).
But the anthropogenic breakdown may not be as evident. Agriculture is 40% (cows belching and rice paddies), energy (35%) and human waste (20%).
Although methane from energy sources is less than a quarter of the world’s total emissions, it’s getting most of the attention for government action (low-hanging fruit).
All sources researched, including Google’s Generative AI, document that overall methane emissions from natural gas are no more than 50% that of coal!
The United States has some of the largest natural gas reserves in the world, which would be advantageous as natural gas continues to replace our coal reliance. The California Energy Commission documented in 2021 that the natural gas contribution of the total energy mix is now at 30%.
But methane should be better understood because it intercepts and impedes the flow of a different spectrum of colored sunlight and has a more dramatic warming influence than CO₂.
Yes, it’s only 200 parts per billion in concentration, which is 1/200th that of CO₂ and averages 10-12 years in our atmosphere.
In the last couple of decades, greenhouse gas emissions have continued to get cleaner through sequestration. This is a process of capturing methane during natural gas extraction and transportation and storing it underground in a suitable geological formation, essentially preventing it from reaching the atmosphere.
Another example is from the University of Copenhagen using light and chlorine to eradicate low-concentration methane from air.
This result gets us closer to being able to remove greenhouse gases from livestock housing, biogas production plants and wastewater treatment plants — further benefiting our climate.
Now we should better understand these two anthropologic greenhouse gases, their impact on climate versus other influences and factors contributing to cooling — offsets that are rarely reported.
A recent example from EOS: “On 15 January 2022, the underwater volcano Hunga Tonga-Hunga Ha‘apai erupted, unleashing a powerful tsunami that destroyed homes and caused deaths throughout Tonga. Another lasting effect of this event — the largest underwater explosion ever recorded by modern scientific instruments — was the huge amount of aerosol and water vapor plumes it launched skyward. They found that in the year following the eruption, the cooling effect from the volcanic aerosols reflecting sunlight into outer space was stronger than the warming caused by water vapors trapping heat in the atmosphere … that lasted through 2023.”
There are human aerosols (combustion of fossil fuels and biomass, as well as from ships and road transport) that actually cool the earth as a “forcing” that actually produces a net effect on warming much lower than reported.
In summary, the energy flow in the earth’s climate system is measured in watts per square meter (W/m₂).
Steven Koonin, a theoretical physicist and a science advisory board member of Novim, a UC Santa Barbara scientific think tank, addressed this in his 2024 update and expansion of his 2021 book, Unsettled — What Climate Science Tells Us, What It Doesn’t, and Why It Matters.
“The sunlight energy absorbed by the earth (the heat energy radiated by the earth) amounts to an average of 239 W/m₂,” he wrote.
“This means the planet radiates heat as if there were about two 100-watt light bulbs in every square meter (11 square feet) of its surface. Human influences today amount to just over 2 W/m₂, or slightly less that 1 percent of the natural flow.”
I know, you’ve got to read it several times. It takes your breath away.