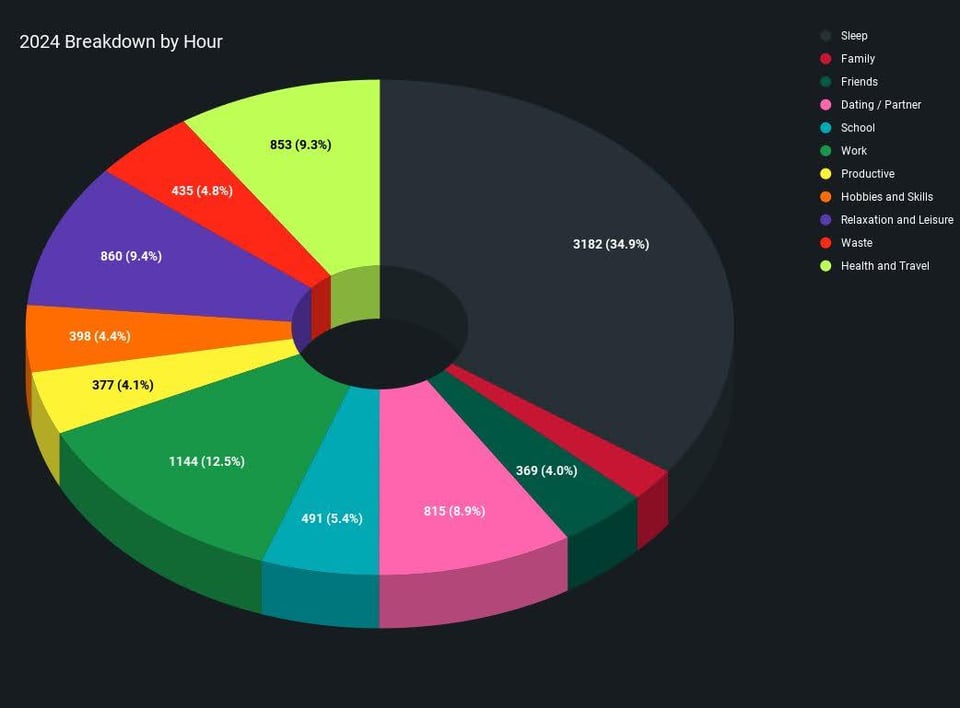
Here is a more detailed breakdown of the number system I used:
0 – Sleep
1 – Family. Any time spent with the family
2 – Friends. Any time spent hanging out with friends.
3 – Dating / Partner. I’m in a committed relationship, so this was all with the same person. A lot of the 3’s were calls at night, since were distance for most of this year.
4 – School. In class for school or when working on school work. First half of the year was my last semester of university, for refrence
5 – Work. Any time I’m getting paid. If I’m
6 – Productive. Groceries, Chores, working on the tracker itself
7 – Hobbies / Skills. I mostly do 3D modeling / printing in my free time, so the majority of is that. I also am learning ASL and doing some CNC stuff this year, which this also tracks.
8 – Relaxation and Leisure. Video games, movies, TV. Generally this only tracks when I’m doing it by myself, since if I was watching something with friends, it would take precident.
9 – Waste. Mostly reddit, but also Tiktok, Shorts, Reels, the whole slew of short form scrolling.
10 – Health and Travel. This is where all of my eating is, along with getting ready in the morning, along with the morning commute to school / work. It also counts driving / flying.
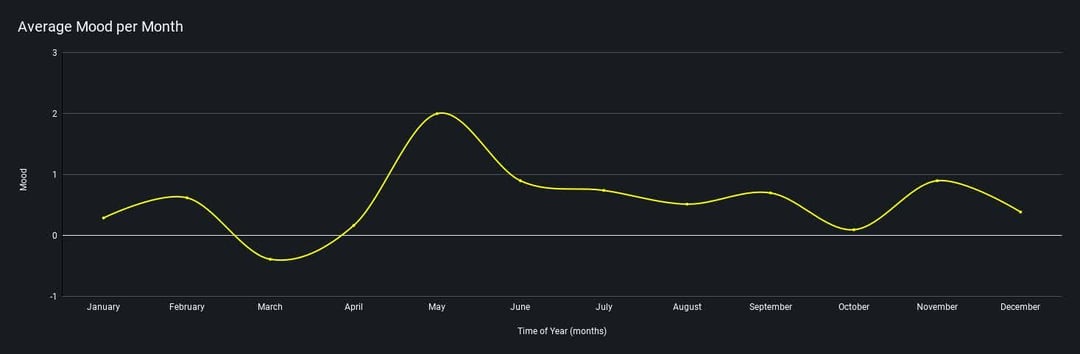
For mood, I tracked it as the difference in the previous day. So if the day before was better than the previous, that’d be a 1. If it was worse, -1, if it was the same 0. For graphing purposes, I used the cumulative change in mood, since I think it reflects better on how my year went.
In particular, you can see the string of terrible days i had in March (semester long coding projects), and a string of great days I had in May (vacation).
I highly, highly recommend not using a 3D chart like your first one. The front slices end up with more visual weight because the edges are visible, e.g. yellow 4.1% has more visible surface area than orange 4.4%, which can make the yellow slice look larger than it is.
Add words to your legend in the second one, especially since not all the colors match up (e.g. sleep is black in the donut chart and white in the normalized stacked bars).
What scale (or just min/max) did you use for mood?
A 3D pie chart in r/dataisbeautiful?
It’s a bold strategy, Cotton.
This year add at least 1% touching grass
I want to know what constituted waste
Not sure why but this chart makes me irritated. Nothing personal OP.
No category for time spent tracking?
Redditors will do anything but talk to a therapist
12.5% at work? What is this magic?
What’s your job and what are you studying!
The existence of the chart explains the 12.5% time spent working.
Tracked every hour and then used a 3D donut chart 😪
So you didn’t eat for a year??? Impressive /s
I too tracked my yeah of hours last year.
Alive – 100%
Thank you for coming to my TED talk.
Almost 9 hours of sleep a night. Wow! I always wake up after 7.
Is browsing Reddit included in Productive or Waste?
It would be interesting to see average monthly changes in time spent working, sleeping etc.
Also we don’t really use pie charts for over 4-5 variables due to interpretability, try a bar chart for better visability.
My chart is probably 1/3 sleep, 1/3 videogames, and 1/3 actually the stuff that matters.
lol interesting. I‘m 100% positive work was more than sleep for me.
Fellow spring depression suferer i see
Fuck march. All my homies hate march. All the bad stuff happens in march, like Caesar’s assassination and shit
Interesting that “family” and “waste” are the same colour….
Doughnut chart, my old enemy. I thought you had passed from history, yet here you are
-narrows eyes checking post history to see if OP is just selling a life tracking app- can’t trust anyone…
Ouch. I spend about 27% of my time working. That doesn’t include the time I could account for driving to work and driving home, which would average 1.25 hours each work day (267 days of the year). That would bump up my time that is taken up by work to close to 31% a year.
9-10 hours a day working. 1.5 driving to and from work daily. 260 working days, minus 5 major holidays we get off (unpaid), plus 12 Saturdays I work through the year (once a month). I do get 14 days PTO and 7 days PSL (paid sick leave) annually, which I make sure to use. But that doesn’t affect the numbers by that much.
I also track every minute of my life! I built an app for it, but I’ve been meaning to port it to apple watch. I just haven’t had time :/
How’d you handle data entry/tracking?
CBT?
Cognitive Behavioural Therapy (aka an OCD diary and the like)
September 13 looks like an…interesting…day. Anniversary?
Were you splitting it by minutes? Like within an hour you took 10 minute bathroom break, wasted 20 minutes and spent rest on work?
This is awesome! What is this on? Excel?
Was it all done manually? Man, i tried doing this back in 2019 and 2018. It was so damn hard to stay consistent.
This is entirely unnecessary and masturbatory. Neither interesting nor beautiful.
How is it you only work that little??
thats really interesting and psycho at the same time.
36 comments
We had the same amount of sex.
I decided to track every hour of my year after I saw [this post](https://www.reddit.com/r/dataisbeautiful/comments/101hvnv/oc_i_tracked_every_hour_of_my_life_for_5_years/) and wanted to do it this year since I knew it’d be really eventful. The spring was my last year in university, and then I moved half way across the country and started my first full time job, so there’s a lot of variation of numbers.
I took this tracker from [https://www.reddit.com/user/_tsweezy_/](https://www.reddit.com/user/_tsweezy_/), and they’ve got a Google Sheets [template for 2025](https://docs.google.com/spreadsheets/d/1tNQz2Exst_lSVvuW-xqHSZZOxtlZloO95c3icSKPVUs/edit?gid=0#gid=0) if you want to do it as well.
Here is a more detailed breakdown of the number system I used:
0 – Sleep
1 – Family. Any time spent with the family
2 – Friends. Any time spent hanging out with friends.
3 – Dating / Partner. I’m in a committed relationship, so this was all with the same person. A lot of the 3’s were calls at night, since were distance for most of this year.
4 – School. In class for school or when working on school work. First half of the year was my last semester of university, for refrence
5 – Work. Any time I’m getting paid. If I’m
6 – Productive. Groceries, Chores, working on the tracker itself
7 – Hobbies / Skills. I mostly do 3D modeling / printing in my free time, so the majority of is that. I also am learning ASL and doing some CNC stuff this year, which this also tracks.
8 – Relaxation and Leisure. Video games, movies, TV. Generally this only tracks when I’m doing it by myself, since if I was watching something with friends, it would take precident.
9 – Waste. Mostly reddit, but also Tiktok, Shorts, Reels, the whole slew of short form scrolling.
10 – Health and Travel. This is where all of my eating is, along with getting ready in the morning, along with the morning commute to school / work. It also counts driving / flying.
For mood, I tracked it as the difference in the previous day. So if the day before was better than the previous, that’d be a 1. If it was worse, -1, if it was the same 0. For graphing purposes, I used the cumulative change in mood, since I think it reflects better on how my year went.
https://preview.redd.it/sv7zp4av1uce1.png?width=1467&format=png&auto=webp&s=c0107b221c559165c0169f9bee147f65dfcaba44
In particular, you can see the string of terrible days i had in March (semester long coding projects), and a string of great days I had in May (vacation).
I highly, highly recommend not using a 3D chart like your first one. The front slices end up with more visual weight because the edges are visible, e.g. yellow 4.1% has more visible surface area than orange 4.4%, which can make the yellow slice look larger than it is.
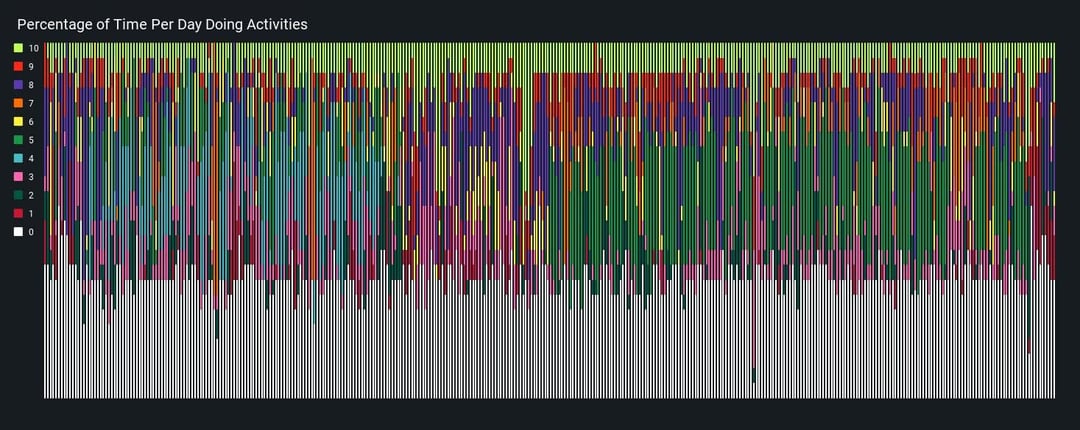
Add words to your legend in the second one, especially since not all the colors match up (e.g. sleep is black in the donut chart and white in the normalized stacked bars).
What scale (or just min/max) did you use for mood?
A 3D pie chart in r/dataisbeautiful?
It’s a bold strategy, Cotton.
This year add at least 1% touching grass
I want to know what constituted waste
Not sure why but this chart makes me irritated. Nothing personal OP.
No category for time spent tracking?
Redditors will do anything but talk to a therapist
12.5% at work? What is this magic?
What’s your job and what are you studying!
The existence of the chart explains the 12.5% time spent working.
Tracked every hour and then used a 3D donut chart 😪
So you didn’t eat for a year??? Impressive /s
I too tracked my yeah of hours last year.
Alive – 100%
Thank you for coming to my TED talk.
Almost 9 hours of sleep a night. Wow! I always wake up after 7.
Is browsing Reddit included in Productive or Waste?
It would be interesting to see average monthly changes in time spent working, sleeping etc.
Also we don’t really use pie charts for over 4-5 variables due to interpretability, try a bar chart for better visability.
My chart is probably 1/3 sleep, 1/3 videogames, and 1/3 actually the stuff that matters.
lol interesting. I‘m 100% positive work was more than sleep for me.
Fellow spring depression suferer i see
Fuck march. All my homies hate march. All the bad stuff happens in march, like Caesar’s assassination and shit
Interesting that “family” and “waste” are the same colour….
Doughnut chart, my old enemy. I thought you had passed from history, yet here you are
-narrows eyes checking post history to see if OP is just selling a life tracking app- can’t trust anyone…
Ouch. I spend about 27% of my time working. That doesn’t include the time I could account for driving to work and driving home, which would average 1.25 hours each work day (267 days of the year). That would bump up my time that is taken up by work to close to 31% a year.
9-10 hours a day working. 1.5 driving to and from work daily. 260 working days, minus 5 major holidays we get off (unpaid), plus 12 Saturdays I work through the year (once a month). I do get 14 days PTO and 7 days PSL (paid sick leave) annually, which I make sure to use. But that doesn’t affect the numbers by that much.
I also track every minute of my life! I built an app for it, but I’ve been meaning to port it to apple watch. I just haven’t had time :/
How’d you handle data entry/tracking?
CBT?
Cognitive Behavioural Therapy (aka an OCD diary and the like)
September 13 looks like an…interesting…day. Anniversary?
Were you splitting it by minutes? Like within an hour you took 10 minute bathroom break, wasted 20 minutes and spent rest on work?
This is awesome! What is this on? Excel?
Was it all done manually? Man, i tried doing this back in 2019 and 2018. It was so damn hard to stay consistent.
This is entirely unnecessary and masturbatory. Neither interesting nor beautiful.
How is it you only work that little??
thats really interesting and psycho at the same time.
You’re wasting more time than you think I bet
I don’t see the pocket-pool time allotment
Comments are closed.