What an odd statistic. If you’re homeless you’re probably homeless for a reason and not in any kind of financial situation to buy a house anyways.
I’m sorry, but this metric is just dumb and trivializes the issue. Homelessness isn’t principally an issue of housing availability. It’s often not even an issue of housing affordability. The main drivers of homelessness are drug addiction and mental illness. Even if you could just give all these people a home it wouldn’t really solve the underlying issue for most. They still wouldn’t be able to to care of it or afford taxes and upkeep. Until you address the underlying issues you can’t actually fix much.
Mortgagecalculator.org? The irony.
I’m not sure this is data. It makes states with large homeless populations look like they are doing better than states with small homeless populations.
Looks like a map of states people want to live in.
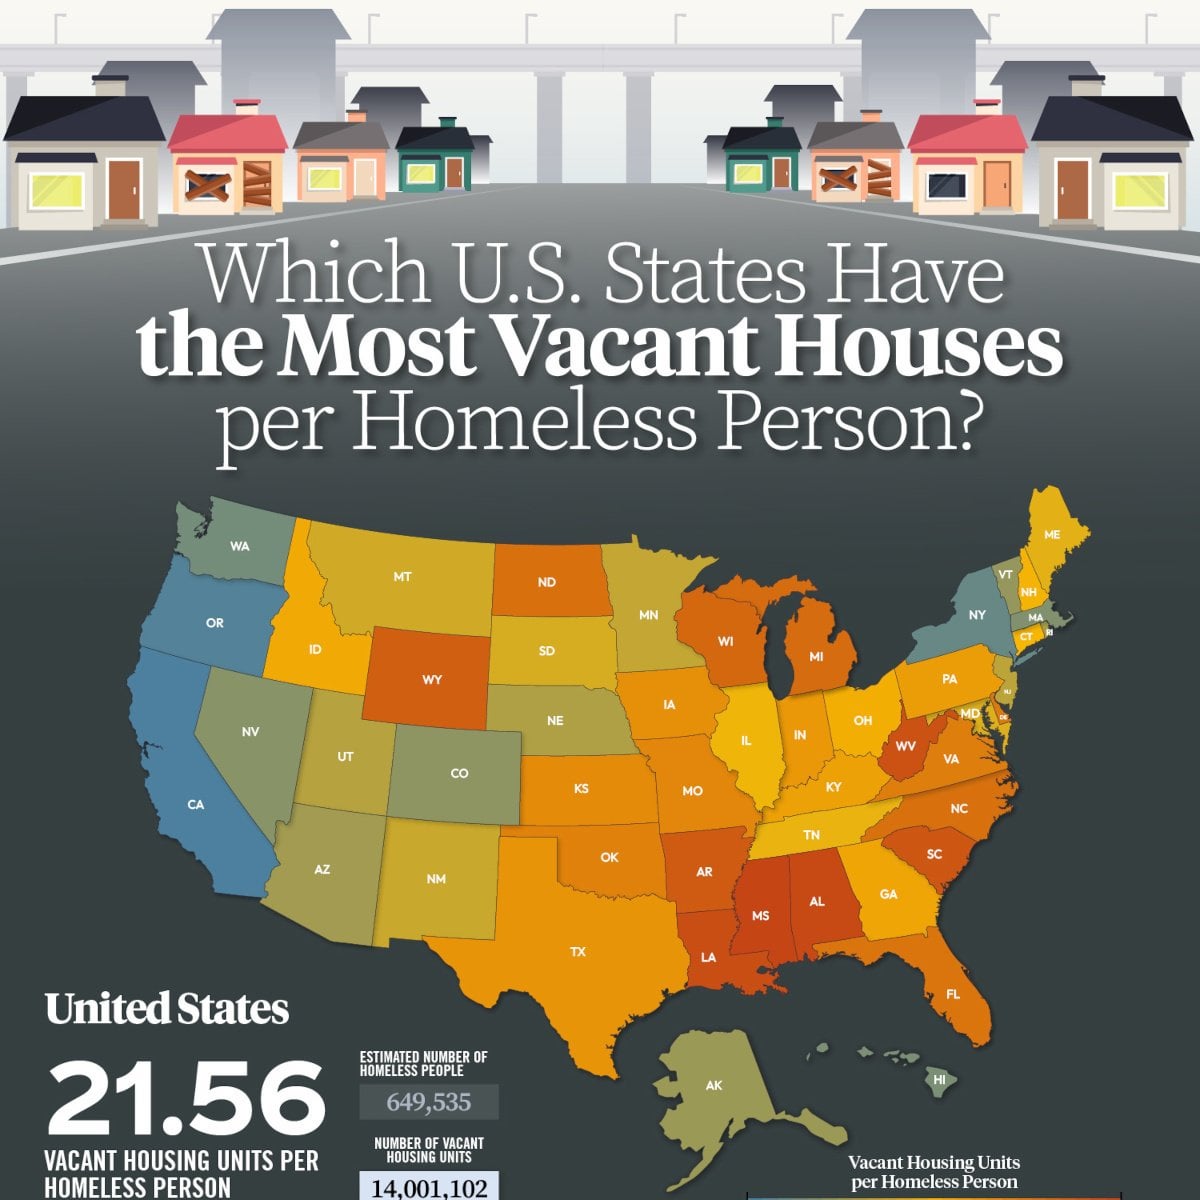
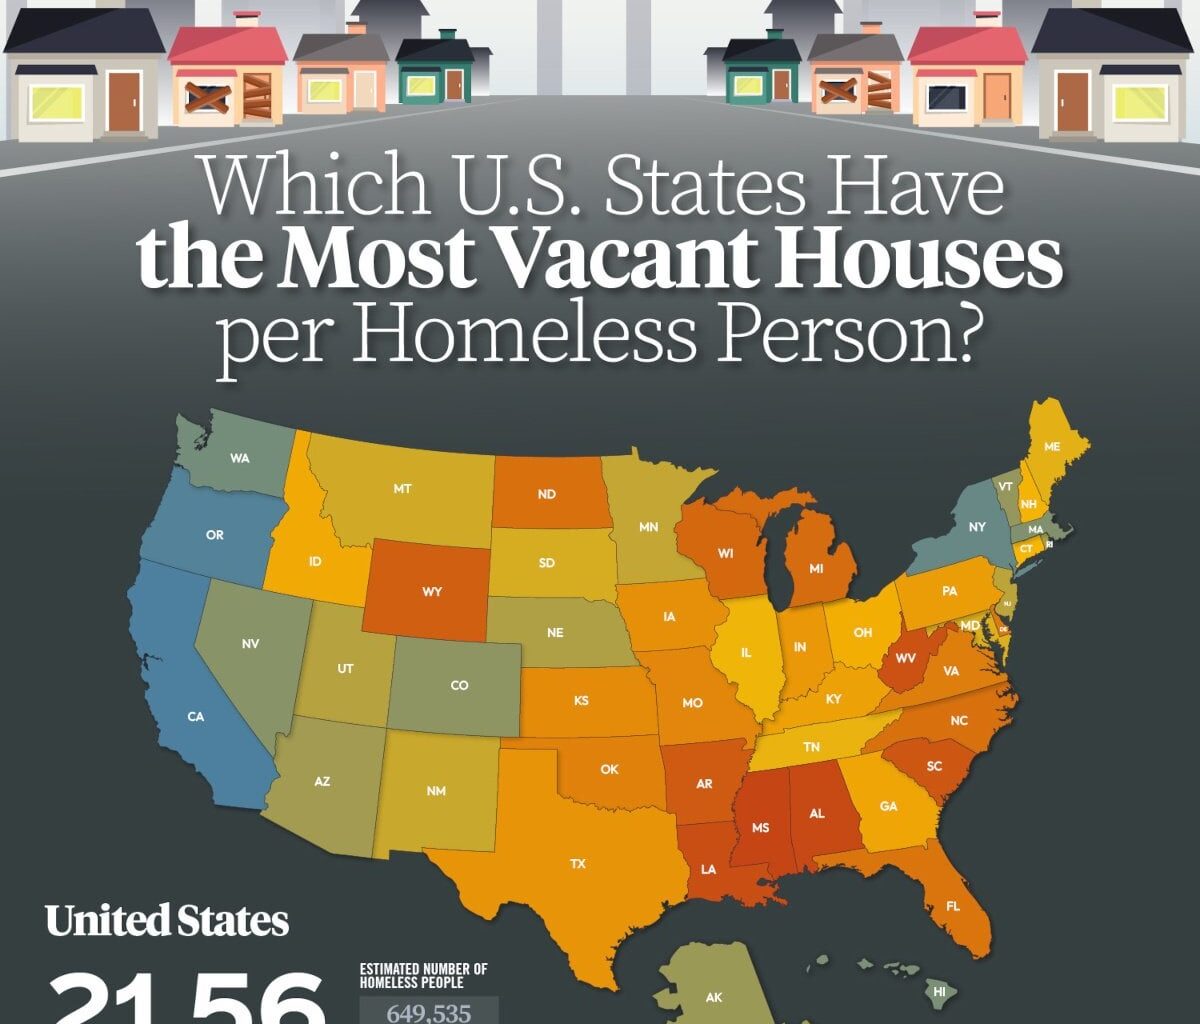
Okay, I’ll say it—California has a lot more homeless people now. Also, how many of the “vacant” houses, especially in rust belt, are boarded up abandoned homes in dangerous urban areas?
Yeah, but they don’t have money. I would imagine the people with vacant property would like money in return for it.
One day I hope the good designers can team up with good statisticians because this is a beautiful useless figure. Mississippi at the top cause less than 1000 homeless people (which sounds suspicious itself). This stat implies there’s some correlation or missed opportunity that doesn’t exist, you’ve just divided two random numbers and thus ordered the states in a meaningless way.
Wisconsin has one of the lowest homelessness rates yet has one of the highest homelessness per vacant house rate.
I think what we can interpret from this data is that if we want to reduce homelessness, we need to build a massive amount of housing in areas that have high levels of homelessness.
How the fuck does Wyoming have like only 500 homeless people
What is the implication? Put the homeless in the houses? Or California takes care of its homeless? Seems an odd map.
The top 8 and 10 of the top 12 are all deep red states. What does that tell us?
12 comments
What an odd statistic. If you’re homeless you’re probably homeless for a reason and not in any kind of financial situation to buy a house anyways.
I’m sorry, but this metric is just dumb and trivializes the issue. Homelessness isn’t principally an issue of housing availability. It’s often not even an issue of housing affordability. The main drivers of homelessness are drug addiction and mental illness. Even if you could just give all these people a home it wouldn’t really solve the underlying issue for most. They still wouldn’t be able to to care of it or afford taxes and upkeep. Until you address the underlying issues you can’t actually fix much.
Mortgagecalculator.org? The irony.
I’m not sure this is data. It makes states with large homeless populations look like they are doing better than states with small homeless populations.
Looks like a map of states people want to live in.
Okay, I’ll say it—California has a lot more homeless people now. Also, how many of the “vacant” houses, especially in rust belt, are boarded up abandoned homes in dangerous urban areas?
Yeah, but they don’t have money. I would imagine the people with vacant property would like money in return for it.
One day I hope the good designers can team up with good statisticians because this is a beautiful useless figure. Mississippi at the top cause less than 1000 homeless people (which sounds suspicious itself). This stat implies there’s some correlation or missed opportunity that doesn’t exist, you’ve just divided two random numbers and thus ordered the states in a meaningless way.
What is this metric telling us? California and Hawaii have some of the highest rates of homelessness in the country (homeless per captia https://usafacts.org/articles/which-states-have-the-highest-and-lowest-rates-of-homelessness/) yet they have the lowest homeless per vacant house rate per this data.
Wisconsin has one of the lowest homelessness rates yet has one of the highest homelessness per vacant house rate.
I think what we can interpret from this data is that if we want to reduce homelessness, we need to build a massive amount of housing in areas that have high levels of homelessness.
How the fuck does Wyoming have like only 500 homeless people
What is the implication? Put the homeless in the houses? Or California takes care of its homeless? Seems an odd map.
The top 8 and 10 of the top 12 are all deep red states. What does that tell us?
Comments are closed.