
The current gold standard in analyzing glycomics data is to express the individual glycans as relative abundances (e.g., as percent of the total ion intensity) and then perform individual statistical tests for each glycan between conditions. As will be shown in the following, this is a fundamentally flawed approach that is both lacking sensitivity as well as incurring an intolerably large fraction of false positives. Two interconnected reasons can be brought forth to explain this. (i) The interdependent nature of relative abundances means that an increase in glycan A demands a decrease in all other glycans—even if these other sequences exhibit a constant number of molecules across conditions (Fig. 1a, b, Supplementary Data 1), causing spurious findings and obscuring real findings. (ii) Additionally, as will be shown, the total number of molecules is rarely invariant across conditions, further distorting the obtained relative abundances and their differences across conditions.
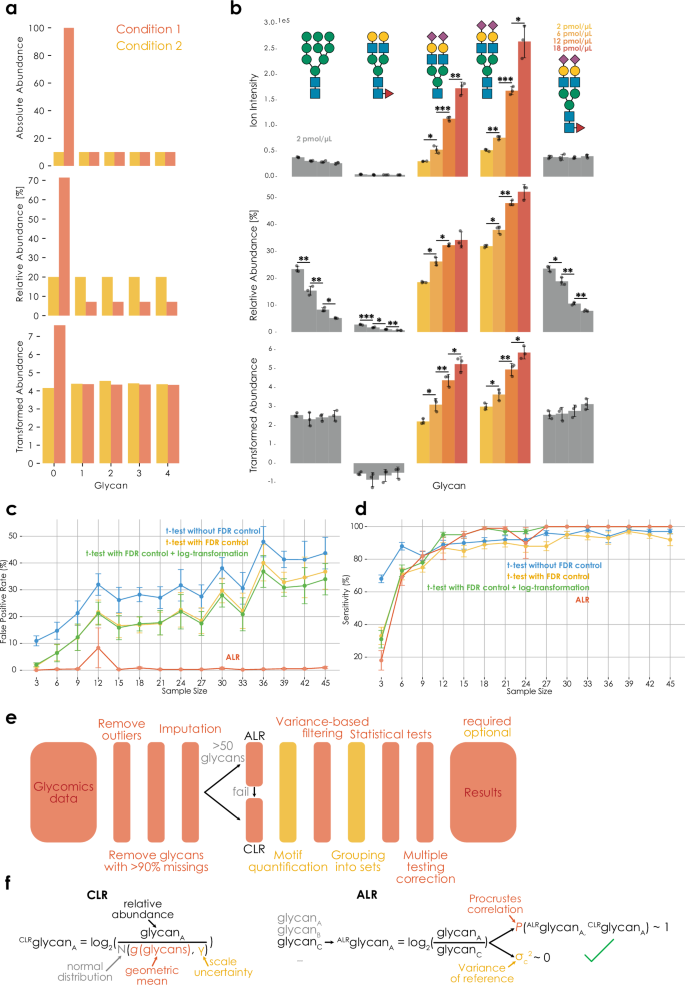
a Relative to absolute abundances (top), relative abundances (middle) distort relationships between glycans, which can be rescued via compositional data analysis (bottom). Transformed abundances indicate CLR-transformed data with an informed-scale model. b Ion intensities (absolute values), relative abundances (%), and ALR-transformed abundances of glycan standards (Supplementary Data 1). Control standards (gray) were added as 2 pmol/µL in all samples, whereas standard 3/4 were added in increasing concentrations (colored). Data are shown as bar graphs with standard deviation (centered at sample mean), with data points (n = 3 independent mixtures) overlayed as a scatterplot. Significance was established via two-tailed Welch’s t-tests. All comparisons without a star did not reach the significance threshold (c False-positive rate (FDR) for identifying spurious differences between conditions increases with sample size when ignoring the compositional nature of glycomics data. Glycomics data were simulated via Dirichlet distributions with defined effects (see “Methods”). For each sample size, 10 independent simulations were performed (n = 10) and results are shown as means with standard deviation as error bars. The Benjamini–Hochberg procedure was used for FDR control, except for ALR (our herein presented workflow, which used the two-stage Benjamini–Hochberg procedure). d Compositional data analysis maintains excellent sensitivity for identifying differences between conditions. Simulations as in (c), with the difference of tracking sensitivity instead of type I error. e Overview of CoDA-improved workflow for differential glycomics abundance analysis. While the schema most closely resembles the differential expression workflow (get_differential_expression), indicated steps were largely preserved in all analyses presented here and in glycowork. ALR was considered to have failed if the Procrustes correlation of the best reference glycan was below 0.9 or if its log2-transformed variance was above 0.1. f Implementing CLR- and ALR-transformations for glycomics data. ALR depicts the successful choice of a reference glycan, which fulfills the desired criteria. Scale uncertainty can further be introduced into ALR by subtracting log2(N(0, γ)) from the reference. Both depictions describe the usage with an uninformed scale model (i.e., scale uncertainty). *p p p Source Data file.
These limitations are, in part, known to practitioners, yet are commonly ignored in practice. Occasionally, researchers will analyze ratios between glycans across conditions, perhaps out of the correct—but tacit—intuition that this mitigates the compositional nature of the data. We maintain here that this compositional nature, if not addressed correctly, is a major problem in the field and will become worse as sample sizes increase, because of unacknowledged bias14,18, leading to incredible false-positive rates of >30% even at rather modest sample sizes (Fig. 1c). Statistically, the interdependent nature of relative abundances can be resolved with transformations such as CLR or ALR6, transforming the data from the Aitchison simplex to real space. The further inclusion of a simple scale uncertainty model (i.e., acknowledging uncertainty as to potential differences in the total number of molecules between conditions) then largely resolves the possibility of scale differences mentioned above18,19. Thus, our workflow for differential glycomics expression analysis, incorporating these principles, is robust to false-positive rates (Fig. 1c), while still maintaining excellent sensitivity (Fig. 1d), presenting a solid state-of-the-art foundation for the burgeoning exploration of glycomics and the role of glycans in diseases.
For a standard, two-group, differential glycan profile analysis, our workflow (Fig. 1e) will automatically infer whether to use ALR or CLR for data transformation (Fig. 1f; see “Methods”; mainly dependent on the presence of a suitable reference component for ALR). On the one hand, this is coupled with outlier treatment, machine learning-based imputation, variance-based filtering, and multiple testing correction5. On the other hand, this also supports analyses on the sequence, motif, and motif set level5. While we expect further advances to tailor these methods more to other types of data, such as glycoproteomics, glycolipidomics, or lectin microarray analysis23, we note that this workflow is applicable to glycoproteomics data already, without any required changes (Supplementary Fig. 1).
A compositional data analysis workflow for comparative glycomics unveils biological insights
Another corollary of compositional data is that real-space distance metrics (e.g., Euclidean distance) are not valid in the Aitchison simplex6. Thus, we reasoned that clustering—usually based on distance matrices—can be improved by CLR/ALR transformation. Applying this to a bacteremia N-glycomics dataset3, we indeed find that Aitchison distance (i.e., Euclidean distance after ALR transformation) results in an improved clustering (Supplementary Fig. 2) that better separates patient and donor classes than clustering on the distances between log-transformed glycan abundances (adjusted Rand index: 0.79 vs 0.74; normalized mutual information: 0.76 vs 0.70). We are further excited to see even finer clustering below disease classes using Aitchison distance, such as a sub-clustering of the healthy volunteers in this sample by sex, which is known to affect glycosylation profiles24.
We then used this insight to reanalyze another dataset, of human B-cell O-glycans from acute lymphoblastic leukemia patients and healthy bone marrow donors25, illustrating the effectiveness of compositional data handling in making comparison between samples (Fig. 2a). The aim of this study was to identify glycoprotein markers of diagnosis and prognosis of mixed-lineage leukemia gene rearranged B-cell precursor acute lymphoblastic leukemia. Healthy bone marrow samples (RB7) were compared to MLL samples, and comparative glycomics was employed to propose biomarker candidates. Upon reanalysis of these data with CLR transformation, we find much more effective clustering between glycans and samples, compared with the same clustering approach using relative abundances (Dunn index 0.828 vs 8.647, which is also higher than the Dunn index of 7.928 that is achieved by log transformation alone).
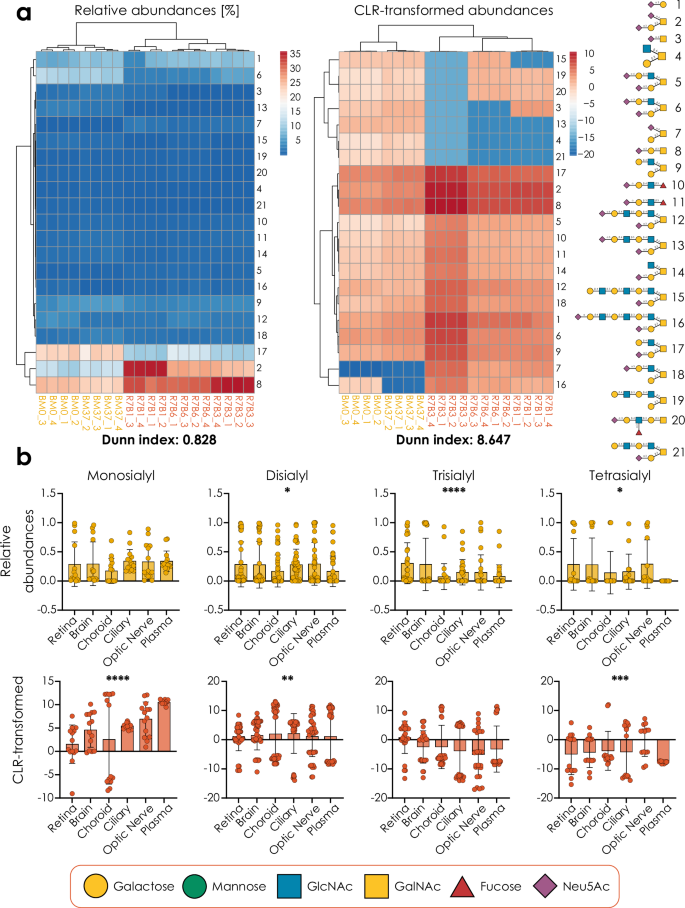
a Heatmaps of O-glycomics data of B-cells from acute lymphoblastic leukemia patients (cases labeled R, in red) and healthy bone marrow donors (cases labeled BM, in yellow)25, with and without CLR transformation, illustrating differences in the effectiveness of heatmap clustering. Clustering was visualized using PHeatmap in R (version 4.3). b The abundance of mono-, di-, tri-, and tetra-sialylated glycosphingolipid species in ocular-related tissues from seven human donors26 (n = 7), presented as relative abundances and CLR-transformed relative abundances, with standard deviations depicted via error bars. Significance was determined via a Friedman test (two-tailed). All glycans in this work are presented via the Symbol Nomenclature for Glycans (SNFG) and are depicted with GlycoDraw57. *p p p p Source Data file.
Additionally, we have analyzed a dataset of GSLs derived from ocular tissues of seven human donors26. This exploratory study aimed to characterize and compare the gangliosides of several ocular and peripheral tissues. Here, we find improved statistical power to detect whether tissues differed in mono-, di-, and tetra-sialylated GSLs, whereas trisialyl species did no longer show differential tissue expression when using CoDA-based analyses (Fig. 2b). This also showed that our workflow is applicable to glycolipid data, extending beyond glycans liberated from protein carriers.
We then extended these re-analyses to a large set of comparative glycomics studies (Table 1), where we overall show that CoDA-based analyses often differed from analyzing relative abundances, indicating the importance of appropriately analyzing glycomics data for valid conclusions. Importantly, even for previous studies without formal statistical analyses, we could confirm and/or revise qualitative conclusions that the respective authors drew from their glycomics data.
Informed-scale models for glycomics shed light on absolute changes in glycans
The scale uncertainty model presented above is an effective means to prevent false positives and can be universally applied by choosing one simple variance parameter γ. As pointed out by others19, this means that this γ parameter, when varied, can even serve as an indicator of effect robustness (i.e., an effect is deemed more robust if it is preserved under a higher γ). We probed this phenomenon with an analysis of a skin cancer O-glycomics dataset27. For each structure, we report the γ-cutoff value at which no significant difference can be detected (Supplementary Fig. 3), providing robustness indicators for each difference and showing that the dysregulation of the disialyl T antigen presented the most robust finding in this case.
The default values of γ, while introducing some variance, still routinely result in reproducible analyses, even if the random seed is not fixed (Supplementary Fig. 4). However, as practically useful as scale uncertainty is, higher values of γ will also inevitably lower the sensitivity of analyses (Supplementary Fig. 3). We thus investigated whether we could also achieve an informed-scale model14, injecting information into our analyses about the actual difference in terms of numbers of molecules between conditions, instead of merely introducing uncertainty about this difference. Many sources for this informed-scale model could be envisioned, yet—since this information is often available to researchers—we started by using the sum of integrated ion intensities from the original glycomics raw data as a measure of the total glycan signal within a sample.
Of course, quantifying glycans via MS1 peak integration is inevitably confounded to some degree by differences in ionization propensity of different glycans and glycopeptides28, which is why it is crucial to include an error term in this scale estimation to account for such effects. It is important to note, however, that the differential ionization propensity of glycans (e.g., sialylated glycans ionizing more efficiently in negative ion mode) does not affect comparison of the same glycan across samples and thus is not necessarily a confounder in this context.
It is crucial to emphasize that this is only a feasible route if glycans from the same amount of (glyco)protein starting material have been analyzed for each sample, as ion intensities only then can serve as an indicator of scale. Following previous work14, we then transform the relative abundances via the ratio of scales between groups, taking into account experimental error in determining those ion intensities in the first place, with the γ parameter used before (Fig. 3a).
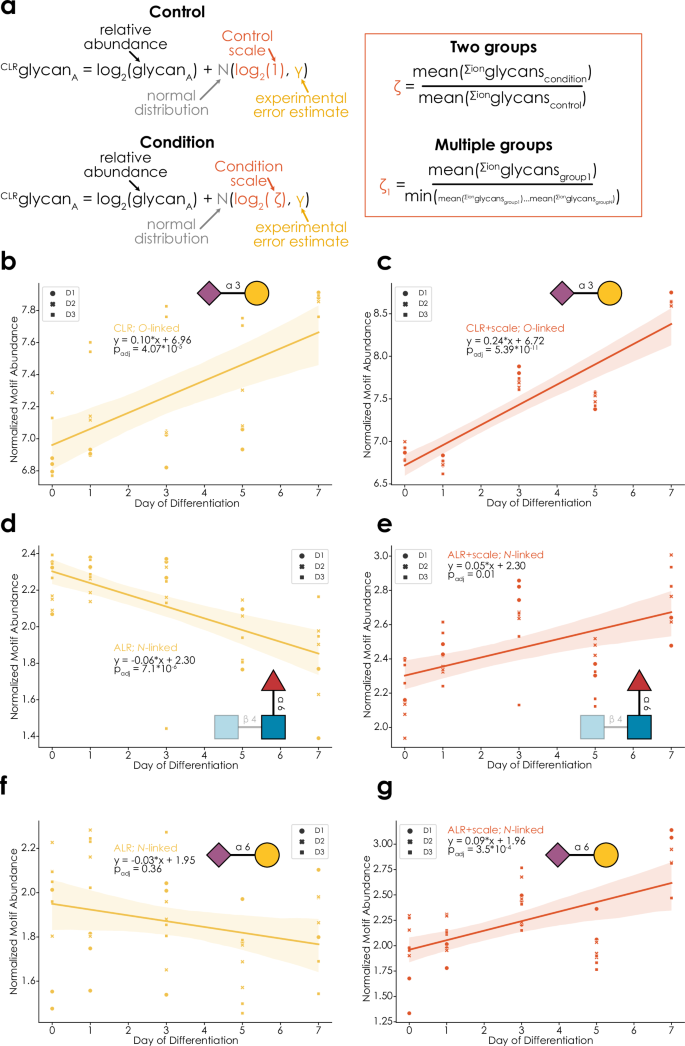
a Applying an informed-scale model to glycomics data analysis. Terms within the equations are explained where necessary. Calculations of the scale factor ζ are provided for two as well as multiple groups and use the integrated ion intensities. The meaning of γ in this case is transformed to an estimate of the experimental error in determining the absolute scales. In ALR, an informed-scale model is achieved by subtracting log2(N(ζ, γ)) from the reference. b, c Monitoring Neu5Acα2-3Gal abundance in O-glycans during macrophage differentiation29. CLR-transformed relative abundances with a scale uncertainty (b) or informed-scale model (c), were used with the get_time_series (glycowork, version 1.3) function to fit an ordinary least squares model, where a two-tailed F-test determined the statistical significance of a linear regression. Donor identity (D1, D2, D3) for each data point is indicated by a unique shape. Monitoring core fucose (d, e) and Neu5Acα2-6Gal (f, g) abundance in N-glycans during macrophage differentiation. ALR-transformed relative abundances with a scale uncertainty (d, f) or with an informed-scale model (e, g) were used with the get_time_series (glycowork, version 1.3) function to fit an ordinary least squares model, where a two-tailed F-test determined the statistical significance of a linear regression. b–g Variance between samples by a 95% confidence band, indicated by shading. Source data are provided as a Source Data file.
When applying this approach to comparative glycomics data, we routinely identified scale differences between conditions (e.g., Supplementary Fig. 5), showcasing how crucial the inclusion of an informed-scale model is for accurate biological conclusions. With the example of a longitudinal dataset of N- and O-glycomes during monocyte-to-macrophage differentiation29, we decided to showcase this scale difference for time series analysis (full results in Supplementary Data 2–9). This study tracked changes in the N- and O-linked glycome of monocytes during differentiation into macrophages, identifying glycans that were differentially or stably expressed during the differentiation process. Reassuringly, some effects, such as an increase in Neu5Acα2-3Gal substructures in O-glycans during differentiation, were generally maintained with an informed-scale model (Fig. 3b, c). Yet, as in this case, the total glycan signal increases over differentiation, and some results changed, compared to CLR/ALR-transformed data, with a scale uncertainty model. Examples here include changing results, such as a reported decrease of core fucosylation in N-glycans5,29 that can no longer be observed when scale is considered (Fig. 3d, e), as the absolute trend now rather pointed to a, marginally significant, increase in core fucosylation. On the other side, additional results may emerge, such as an absolute increase of Neu5Acα2-6Gal termini in N-glycans during differentiation, yet only when scale is considered (Fig. 3f, g). It is important to note that, despite the increase in scale over time, some decreases in abundance were still maintained under this informed-scale model (Supplementary Fig. 6), potentially indicating an actual decrease in the number of specific molecules over the differentiation course.
As performed by some practitioners in the field, another possible avenue could have been to perform analyses directly on the raw ion intensities instead of relative abundances, possibly after log transformation. However, we find that the variance of ion intensities typically outweighs the additional information that they contain (Supplementary Fig. 7) and hence propose that relative abundances, combined with an informed-scale model that is derived from ion intensities, are a superior approach to analyzing comparative glycomics data.
Analyzing glycome similarity and cross-class regulation as fresh views on differential glycome profiling
Many biological questions cannot be answered by a differential expression approach, which is why we set out to develop methods that incorporate the CoDA principles laid out above. Example applications for this include questions related to overall glycome changes beyond individual sequences/motifs, biomarker discovery, or regulation across data modalities. To demonstrate the capabilities of these data analysis modalities, we then set out to reanalyze suitable glycomics datasets to gain robust insights. A study30 investigating the impact of HIV gag-transfection on the N- and O-glycomes of cells additionally used a mock-transfected group as a procedural control. While differential expression analysis revealed significant differences for one N-glycan motif (antennary fucosylation; Supplementary Data 10) between the non-transfected and mock-transfected control groups, our alpha biodiversity indices reported no significant differences (Fig. 4a, b), suggesting that the differentially expressed motifs are of relatively low abundance. This corroborates the conclusions of the published study30, which is that the mock-transfected cells were largely representative of the non-transfected cells, and the transfection process itself had only a minor influence on the glycome.
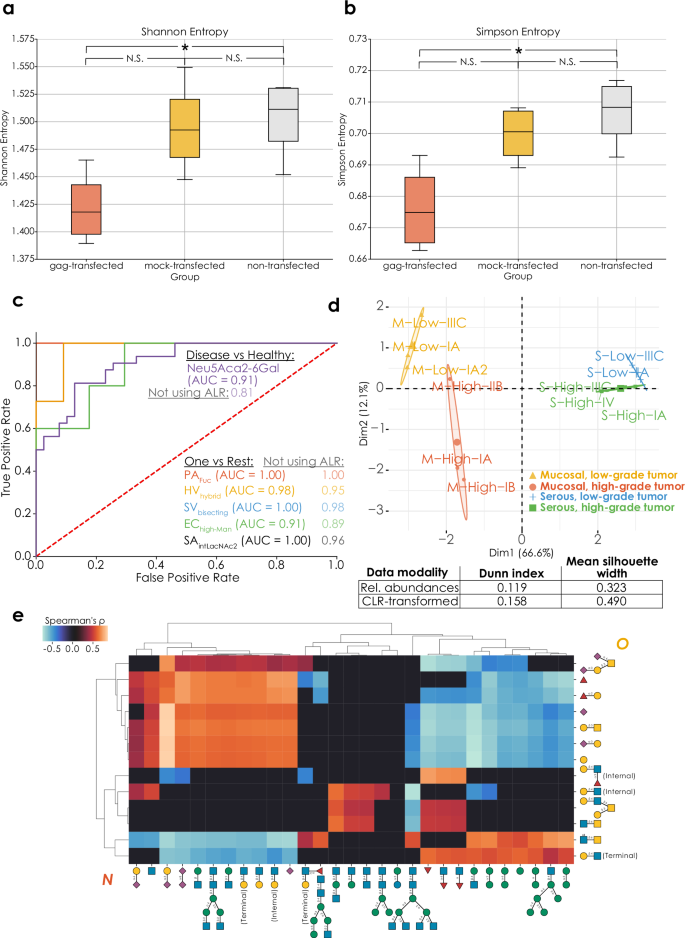
Significant differences (p O-glycome alpha diversities (a: Shannon entropy, p = 0.011; b: Simpson entropy, p = 0.016) of HEK293 cells transfected with HIV-1 gag and untransfected controls30 (n = 8), determined via two-tailed Welch’s t-tests with Benjamini–Hochberg correction. Data are depicted as mean values, with box edges indicating quartiles, and whiskers indicating the remaining data distribution up to the 95% confidence interval. c Identifying specific serum biomarkers for bacterial infection. Using the get_roc function (glycowork, version 1.3) on an ALR-transformed serum N-glycomics dataset with an informed-scale model, we obtained the best motif that separated healthy and bacteria-containing samples (total N = 71). We then, for each infecting pathogen, repeated this process as a One-Vs-Rest problem to identify the best motif that allowed us to separate the infecting pathogen from all other classes (other pathogens and healthy donors). Performances of this workflow without ALR transformation are also shown for comparison. PA Pseudomonas aeruginosa, HV Healthy volunteers, SV Streptococcus viridans, EC Escherichia coli, SA Staphylococcus aureus, Hybrid hybrid N-glycans, bisecting bisecting GlcNAc, high-Man high-mannose; intLacNAc2 internal LacNAc type 2. Area-under-the-curve (AUC) values are shown for all markers and a dashed line represents random assignment. d Beta-biodiversity clusters ovarian cancer types. We used a distance matrix from get_biodiversity (glycowork, version 1.3) of ovarian cancer O-glycomes32 based on Aitchison distance for a principal component analysis (PCA), in which the different types and grades were well separated, indicated by colored clusters. The Eigenplot displays PCA clustering of distances from CLR-transformed data, with clustering metrics describing the comparison with PCA clustering of un-transformed data presented in an associated table. e Significant correlations (p N- and O-glycomics data during differentiation from monocytes to macrophages29, derived from the get_SparCC function (glycowork, version 1.3). Source data are provided as a Source Data file.
Biomarker discovery rests on identifying molecular features that reliably distinguish, via their abundance, between two or more states. In the context of a glycan, a feature can refer to a full glycan molecule or any of the substructures found in such molecules (e.g., fucosylation, Lewis X, level of branching in N-glycans, etc.) Glycan features have been emerging as very sensitive biomarker candidates11, yet many glycan alterations are due to systemic changes (e.g., inflammation31) and thus potentially not very specific to a particular condition. To enable biomarker discovery within our CoDA framework, benefiting from an informed-scale model, we developed a receiver operating characteristic–area under the curve (ROC-AUC) pipeline to first identify the best distinguishing substructure between healthy and infected individuals from a recent dataset3, where serum N-glycomics was performed to identify potential strain-specific biomarkers during bacteremia. Our analysis highlighted terminal Neu5Acα2-6Gal epitopes with an AUC of 0.91 (Fig. 4c). Then, addressing the issue of specificity of glycan-derived biomarkers, we engaged in a One-vs-Rest approach of the same function, uncovering the best glycan substructure to identify each specific bacterial infection, resulting in excellent biomarker candidates for each of the assayed bacterial species (AUC 0.91–1.00; Fig. 4c) and extending the findings of the original study3.
We then set out to show that glycomics beta-biodiversity—changes in glycan distribution measured by Aitchison distance6—is a potent means for clustering subjects from an ovarian cancer dataset32. In this dataset, glycoprotein secretions from serous and mucinous tumors of different grades were analyzed, to determine biomarker candidates of disease class and severity. A principal component analysis of the beta-diversity distance matrix indeed clearly showed the simultaneous clustering of mucinous and serous tumors as well as their respective high- and low-grade subgroups (Fig. 4d), which was quantifiably superior to clustering distances from un-transformed abundances (Dunn index and silhouette width in Fig. 4d). Notably, the first principal component here stratified mucinous and serous tumors, while the second principal component effectively separates high- and low-grade tumors, suggesting that the same changes in the glycome differentiate high- and low-grade tumors in distinct tissues.
Lastly, we wanted to address the, somewhat artificial, separation of the glycome into different classes, largely driven by methodological constraints. Thus, we sought to establish a cross-class analysis modality by developing a CoDA-based correlation analysis across glycan classes, conceptually similar to SparCC21. For this, we again investigated correlations between structural motifs associated with N- or O-glycans during macrophage differentiation29 (Fig. 4e). N-linked sialylation, LacNAc extension, and biantennary complex structures showed positive correlation with sialylated and Fucα1-2Gal-containing O-glycans, and negative correlation with core 2-related structural motifs. The latter, in contrast, were found to positively correlate with high-mannose structures as well as N-glycans modified with core fucosylation or bisecting GlcNAc. Overall, while sialylation was positively correlated across classes, fucosylation showed no significant correlation between N- and O-glycans. Interestingly, we even identified a negative correlation between the presence of Lewis X motifs in N- and O-glycans, respectively.
Since we designed this workflow to be maximally flexible, we could use the same method to analyze cross-correlations between glycomics and other data types. We used this to investigate glycan motif–transcript relationships in the abovementioned B-cell dataset (Supplementary Fig. 8), still in the herein developed CoDA framework, now applied to both glycomics and transcriptomics data. This revealed significant associations of glycogenes and their cognate motif (e.g., ST6GALNAC1 and Neu5Acα2-6GalNAc in O-glycans, FUT4 and Fucα1-3GlcNAc in N-glycans, or GCNT4 and the core 2 structure in O-glycans) but also interesting negative associations (e.g., the N-glycan branching enzyme MGAT4A and fucose-containing motifs) potentially hinting at motifs interfering with the action of an enzyme, such as branching inhibiting antennary fucosylation (or vice versa). Overall, our SparCC-inspired analysis of cross-class correlations can yield insights into possible co-regulatory mechanisms that would otherwise remain hidden if each dataset is considered independently.
A CoDA meta-analysis of oligo- and pauci-mannose N-glycans in cancer
Previous results have established the robustness and sensitivity of our approach to glycomics data analysis. Next, we wanted to combine this with the established framework of engaging in meta-analyses, formally combining results across studies for robust conclusions, to showcase the biological implications of these analysis capabilities. For this, we used an existing set of comparative glycomics datasets investigating the relative abundance of oligo- and pauci-mannose N-glycans across different types of cancer4,33, comparing healthy tissue and tumor samples (total N = 194 across nine datasets). While, for CLR-transformed data, this resulted in a number of structures that exhibited significant dysregulation across studies (Supplementary Data 11), other structures exhibited more modest or inconclusive effects (Fig. 5a).
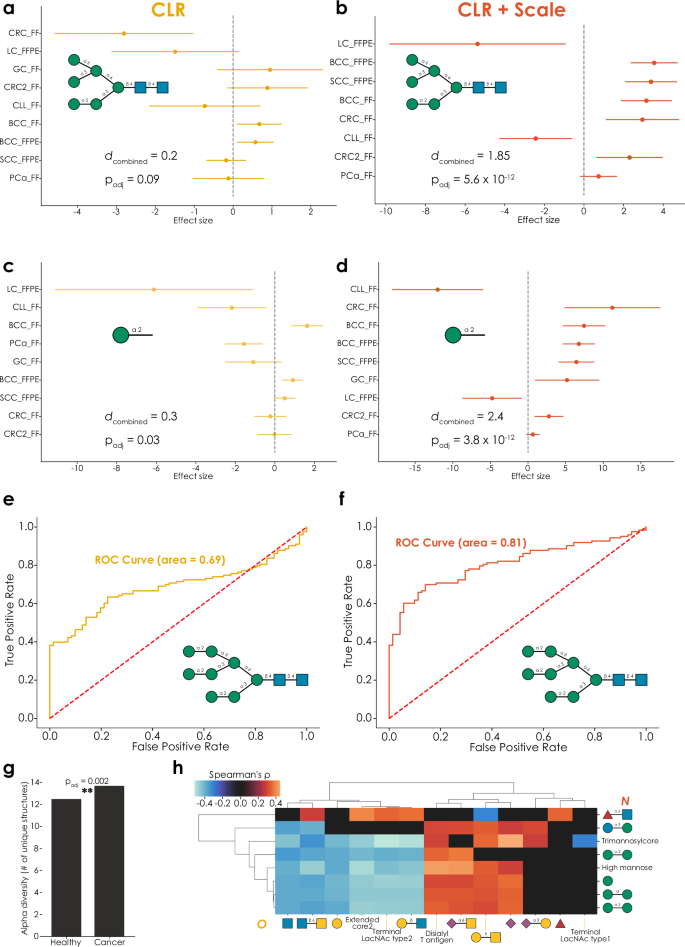
Both full structures (a, b) and motifs (c, d) are consistently dysregulated across cancer types in a fixed-effects meta-analysis of CLR-transformed relative abundances (using the get_meta_analysis function within glycowork, version 1.3), using a single two-tailed t-test of the combined effect size. Adding an informed-scale model based on the ion intensities (b, d) improves analytical sensitivity and reveals an absolute increase of most considered structures and motifs in cancer. Total n = 194 and combined effect sizes are shown as Cohen’s d. All results can be found in Supplementary Data 11–14. A pairwise analysis of CLR-transformed data from healthy samples and cancer tissues reveals structures of moderate predictiveness (e; AUC = 0.69), which is substantially improved by the informed-scale model (f; AUC = 0.81). ROC curves were analyzed and generated with the get_roc function (glycowork, version 1.3). g In a pan-cancer analysis of oligo- and pauci-mannose N-glycans, cancer samples exhibited a significantly greater alpha diversity of these structures (p = 0.002), measured as the number of expressed unique structures per sample, calculated with the get_biodiversity function (glycowork, version 1.3), using a single two-tailed Welch’s t-test. h Correlating CLR-transformed N-glycomics and O-glycomics data from the same prostate cancer patients in different stages reveals substantial cross-class regulation. Only significant correlations, derived from the get_SparCC function (glycowork, version 1.3), are shown as Spearman’s rho, with everything else set to zero. **p Source Data file.
One goal of such a meta-analysis is to identify potential biomarkers, or molecules to target for imaging and other endeavors. Hence, identifying the decrease of a structure such as Manα1-3(Manα1-6)Manα1-6(Manα1-3)Manβ1-4GlcNAcβ1-4GlcNAc in cancer (dcombined = −0.5, padj = 0.0004) could be viewed as an actionable finding. Yet this translation of relative decrease into absolute decrease pre-supposes equal scale between conditions. We thus repeated this analysis with an informed-scale model based on the ion intensities and noticed that, on average, the total glycan signal increased in cancer (average scale ratio: 1.34). Factoring in this scale difference led to much stronger findings (Fig. 5b, Supplementary Data 12) that were, on average, indicating an increase in most oligo- and pauci-mannose N-glycans in cancer, including the abovementioned structure (dcombined = 1.31, padj = 6.2 × 10⁻¹²). Hence, analyzing the data without scale would have erroneously resulted in the conclusion that some of these structures decrease in absolute abundance between conditions, whereas the opposite seems to be true.
On the motif level, we observe similar trends (Fig. 5c, d, Supplementary Data 13 and 14), in that including an informed-scale model improves sensitivity and provides a better indication of the actual biological changes between conditions. In the case of terminal Manα1-2 epitopes (Fig. 5c, d), we for instance only report an absolute decrease in lung cancer and chronic lymphocytic leukemia, after factoring in scale differences between conditions. Findings from these methods could then provide a more solid foundation for (i) general-purpose biomarkers as well as (ii) specific markers that can be accurately tracked with methods that are sensitive to absolute expression levels (e.g., staining).
Reasoning that the combination of CLR and an informed-scale model do, in fact, more accurately identify biomarker candidates from glycomics data, we then engaged in a biomarker analysis via the ROC curve analysis workflow we developed herein. This indeed resulted in better predictive performance in a pan-cancer setting for the same structures (Fig. 5e, f; AUC 0.69 vs 0.81). We also noted that oligo- and pauci-mannose N-glycans in cancer exhibited a significantly higher alpha diversity (Fig. 5g; number of unique expressed structures; p = 0.002), again emphasizing the potential for cancer-relevant structures.
Lastly, since we had access to both N- and O-glycomics data of one cancer dataset, prostate cancer34 (N = 55), we also performed a cross-class correlation analysis of CLR-transformed data (Fig. 5h). A positive correlation of fucose-containing glycans in both classes that we identified here could indicate a co-regulation across classes in prostate cancer, especially when contrasted to the lack of cross-class correlation of fucosylation during macrophage differentiation (Fig. 4e). Further, the neutral extension of core 2 structures was negatively correlated with oligo-mannose structures, while O-linked sialylation correlated positively with oligo-mannose structures. We again would like to note that these cross-class dependencies are crucial for interpretation, as an analysis that only factored in prostate cancer N-glycans might ascribe phenotypic effects to increases in oligo-mannose structures, while this is potentially confounded by concomitant increases in O-glycan sialylation. We thus urge researchers to factor in the entire glycome, which can be analyzed by methods such as the one presented here. We leave this section with a firm conviction that glycome analysis needs to be (i) statistically sound, (ii) robust yet sensitive, and (iii) integrating information across glycan classes, in order to be useful in the laboratory as well as, eventually, in the clinic.