![[OC] State Population Growth Rate vs National Average](https://www.europesays.com/wp-content/uploads/2025/01/5ckmvmy49fee1-1920x1024.png)
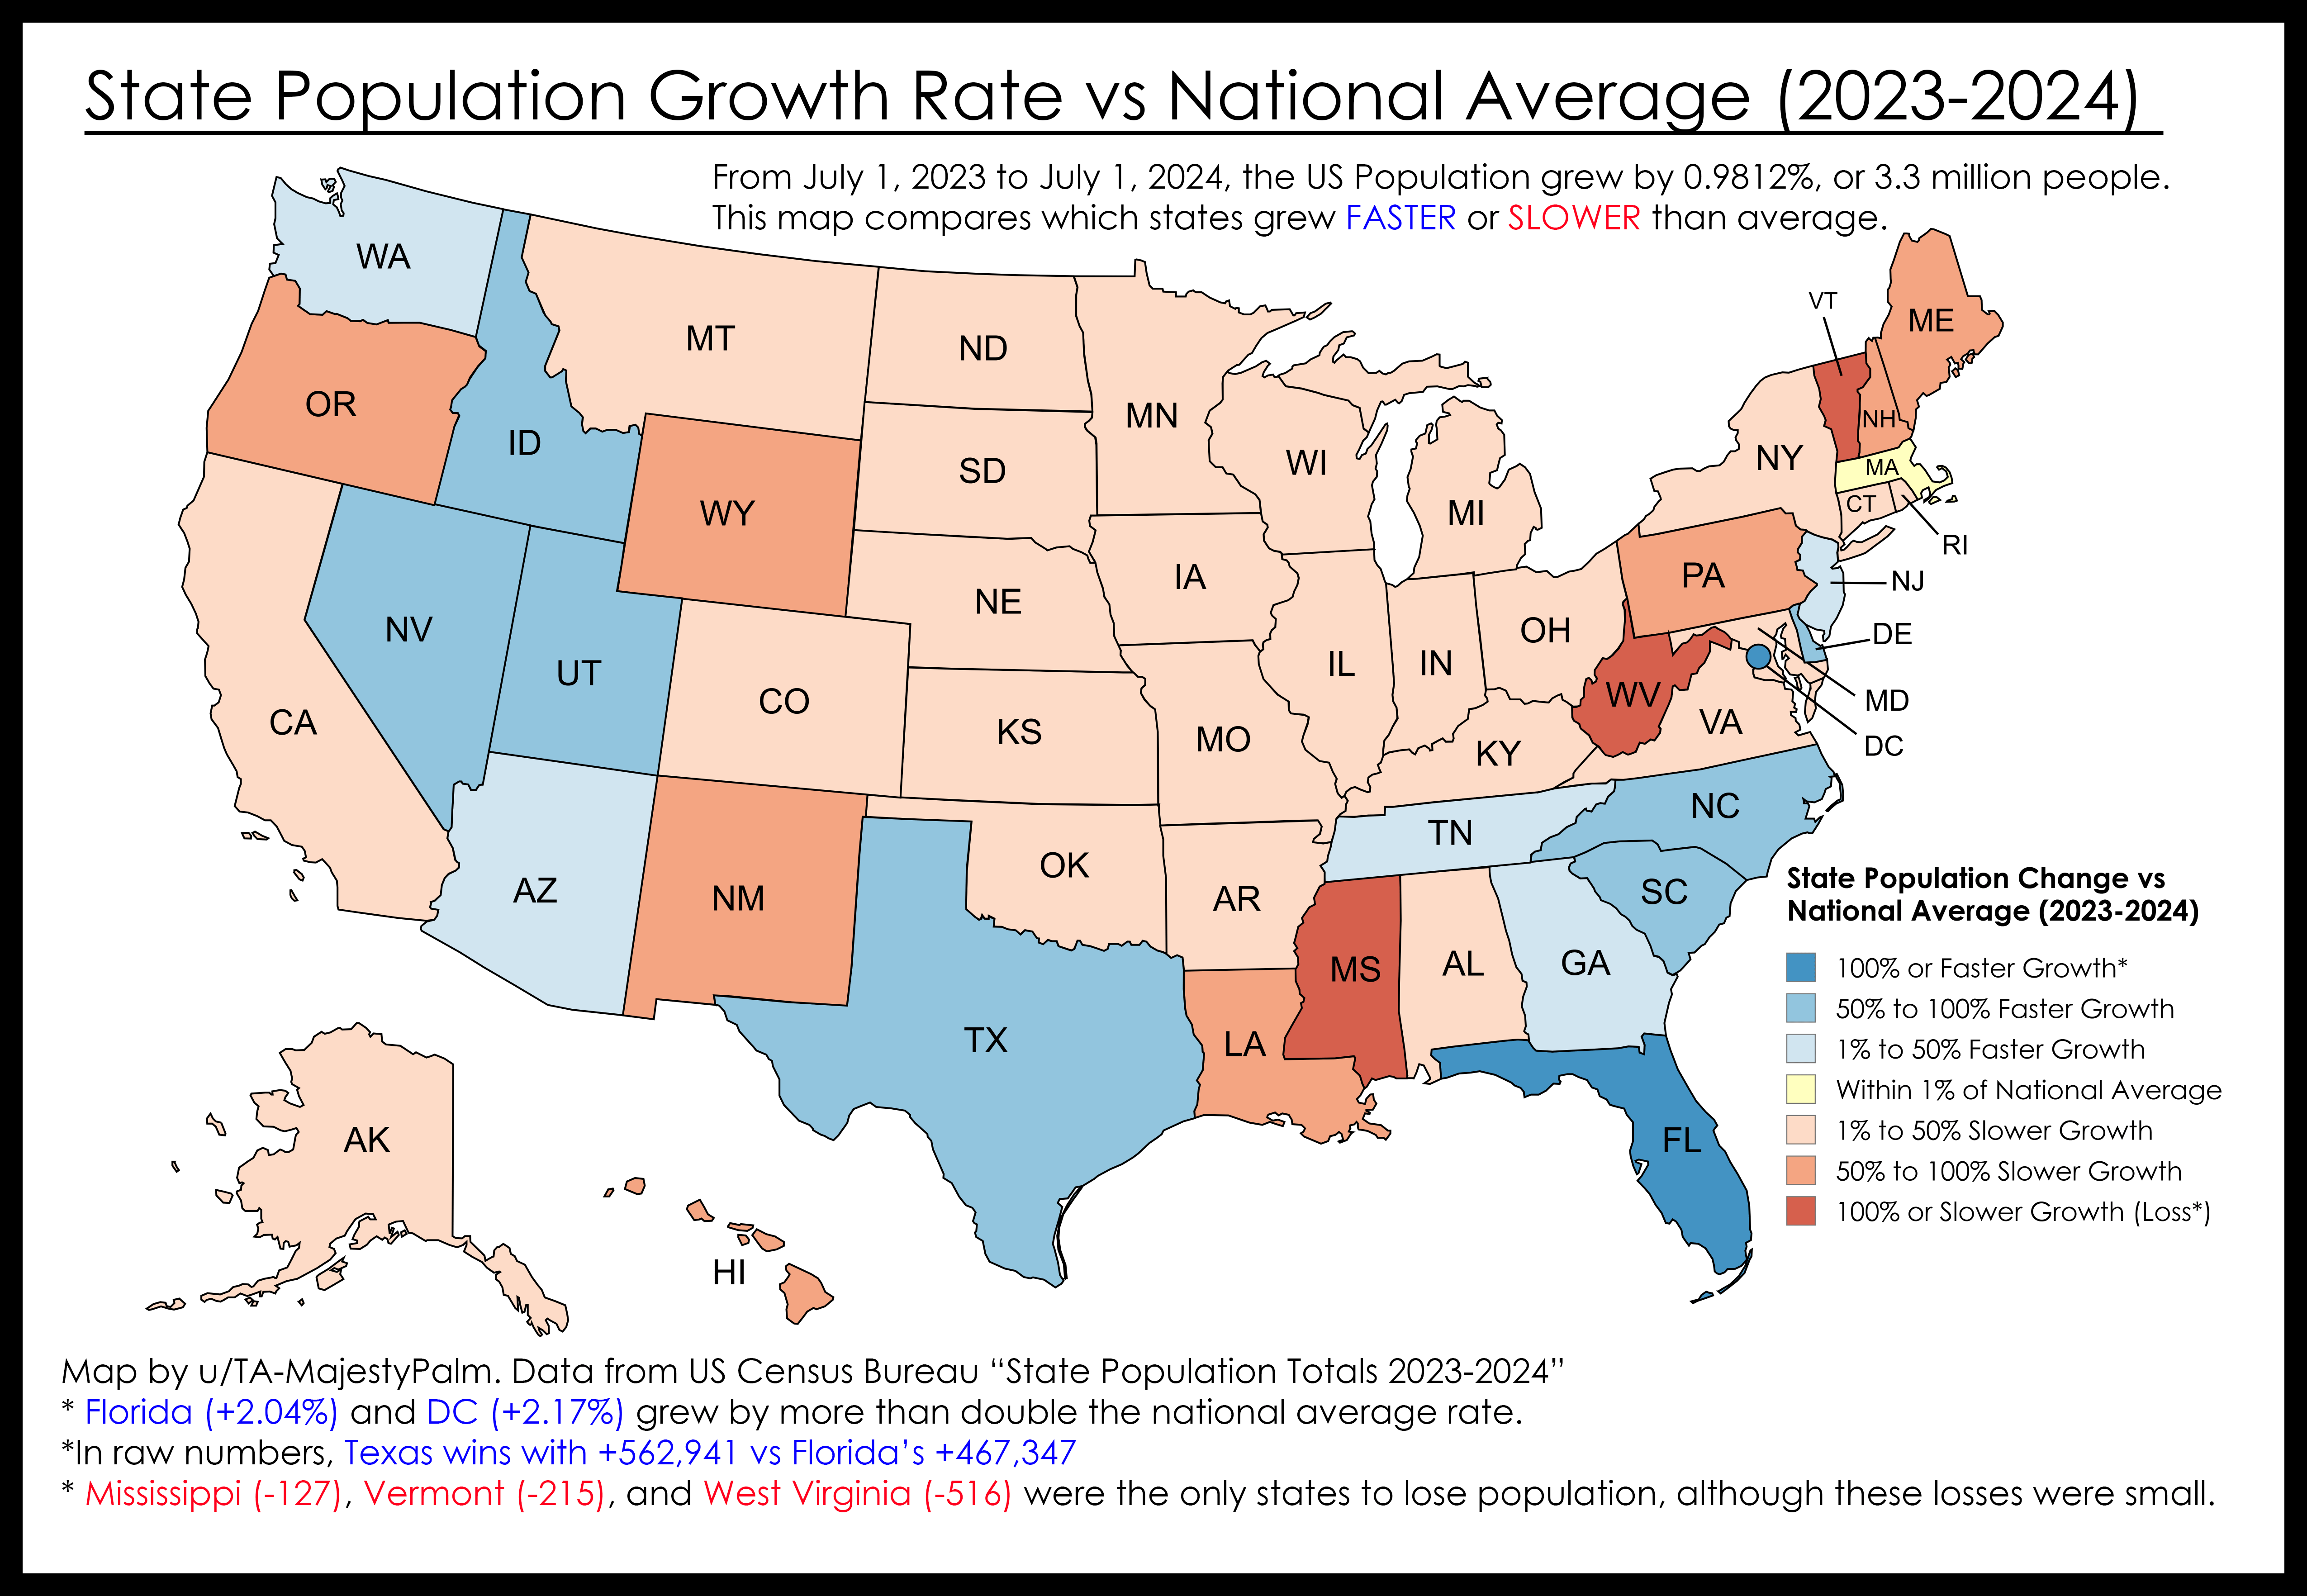
Map I made comparing state population growth rates with the national average growth rate this past year. Created with mapchart and excel.
Source: https://www.census.gov/data/tables/time-series/demo/popest/2020s-state-total.html
County Level Data (2018-2023) https://www.reddit.com/r/dataisbeautiful/s/UaYjK3amj2
Posted by TA-MajestyPalm
2 comments
Map I made comparing state population growth rates with the national average growth rate this past year. Created with mapchart and excel.
Source: https://www.census.gov/data/tables/time-series/demo/popest/2020s-state-total.html
County Level Data (2018-2023) https://www.reddit.com/r/dataisbeautiful/s/UaYjK3amj2
Cool. But I’d like to see the neutral range expanded a bit. Maybe within 5%? Or 10%?
Comments are closed.