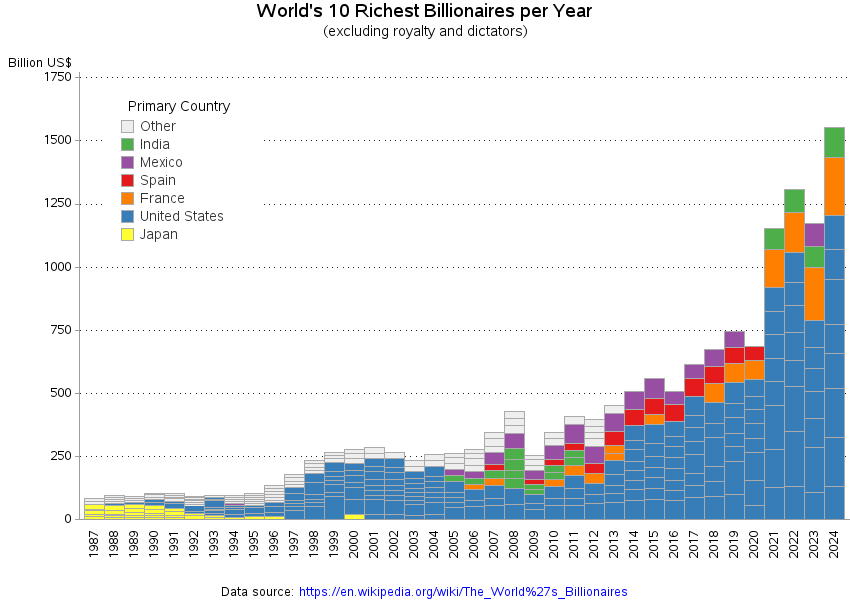
This is my ‘remix’ of a graph JoeFalchetto posted a few days ago. Their graph showed how many billionaires in the top 10 per country, whereas mine shows the $ amount. Yes, it’s not fair to compare 1987 dollars to 2024 dollars – I could convert it to current dollars or something. But it is what it is, and this is what I wanted to see a graph of (it’s good to look at the same data in many different ways, and this is one of the ways).
One feature I find interesting is that the amounts really went up during the last 4 years. Did the billionaires get richer? Did governments print more money? Other factors/reasons?
I’m pretty surprised Japan fell out in 2000 and China isn’t even on the list
Title probably would need to be different, do you mean the top 10 richest billionaires’ cumulated wealth?
What’s up with that spike on 2020-2021
Something doesn’t seem right with your data.
I presume the rectangular section are one billionaire’s net worth each?
If you look at, say, 2024, then the orange rectangle, which must be Bernad Arnault (net worth around 200 billion in 2024), appears to be longer than any of the blue rectangles, which should include both Musk (Net worth estimated around 400 billion at the end of 2024), Jeff Bezos (net worth around 250 billion in 2024) and Mark Zuckerberg (net worth around 219 billion in 2024).
Also, you’re comparing sums from the 1980s to today, but don’t specify whether this is inflation-adjusted? (It probably should be, or at least an inflation-adjusted version should be provided.)
Adjust for inflation or I can’t make full sense is this
Why did Japan have all those billionaires in the 80s? Was it purely cause the auto and tech businesses were popping off so hard?
What’s going on with the guy from Mexico?
Where is Russia? I would think that they are represented.
Really shows how much wealth inequality has gone off the rails since the 2008 recession.
My uneducated ass is surprised to see India here
Why the hell didn’t they go largest to smallest within a given year and country
Rich people fucking loved the pandemic. And now the US pulled out of the World Health Organization, who helped make that pandemic shorter.
“Money is speech” became a thing in 2010, number go up ever since. I wish I could get that kind of representation in government
14 comments
Data source: https://en.wikipedia.org/wiki/The_World%27s_Billionaires
Software used: SAS
Here is a version with HTML mouse-over text on the bars, so you can see the names/amounts/etc:
https://robslink.com/SAS/democd104/billionaires_top_10.htm
This is my ‘remix’ of a graph JoeFalchetto posted a few days ago. Their graph showed how many billionaires in the top 10 per country, whereas mine shows the $ amount. Yes, it’s not fair to compare 1987 dollars to 2024 dollars – I could convert it to current dollars or something. But it is what it is, and this is what I wanted to see a graph of (it’s good to look at the same data in many different ways, and this is one of the ways).
One feature I find interesting is that the amounts really went up during the last 4 years. Did the billionaires get richer? Did governments print more money? Other factors/reasons?
I’m pretty surprised Japan fell out in 2000 and China isn’t even on the list
Title probably would need to be different, do you mean the top 10 richest billionaires’ cumulated wealth?
What’s up with that spike on 2020-2021
Something doesn’t seem right with your data.
I presume the rectangular section are one billionaire’s net worth each?
If you look at, say, 2024, then the orange rectangle, which must be Bernad Arnault (net worth around 200 billion in 2024), appears to be longer than any of the blue rectangles, which should include both Musk (Net worth estimated around 400 billion at the end of 2024), Jeff Bezos (net worth around 250 billion in 2024) and Mark Zuckerberg (net worth around 219 billion in 2024).
Also, you’re comparing sums from the 1980s to today, but don’t specify whether this is inflation-adjusted? (It probably should be, or at least an inflation-adjusted version should be provided.)
Adjust for inflation or I can’t make full sense is this
Why did Japan have all those billionaires in the 80s? Was it purely cause the auto and tech businesses were popping off so hard?
What’s going on with the guy from Mexico?
Where is Russia? I would think that they are represented.
Really shows how much wealth inequality has gone off the rails since the 2008 recession.
My uneducated ass is surprised to see India here
Why the hell didn’t they go largest to smallest within a given year and country
Rich people fucking loved the pandemic. And now the US pulled out of the World Health Organization, who helped make that pandemic shorter.
“Money is speech” became a thing in 2010, number go up ever since. I wish I could get that kind of representation in government
Comments are closed.