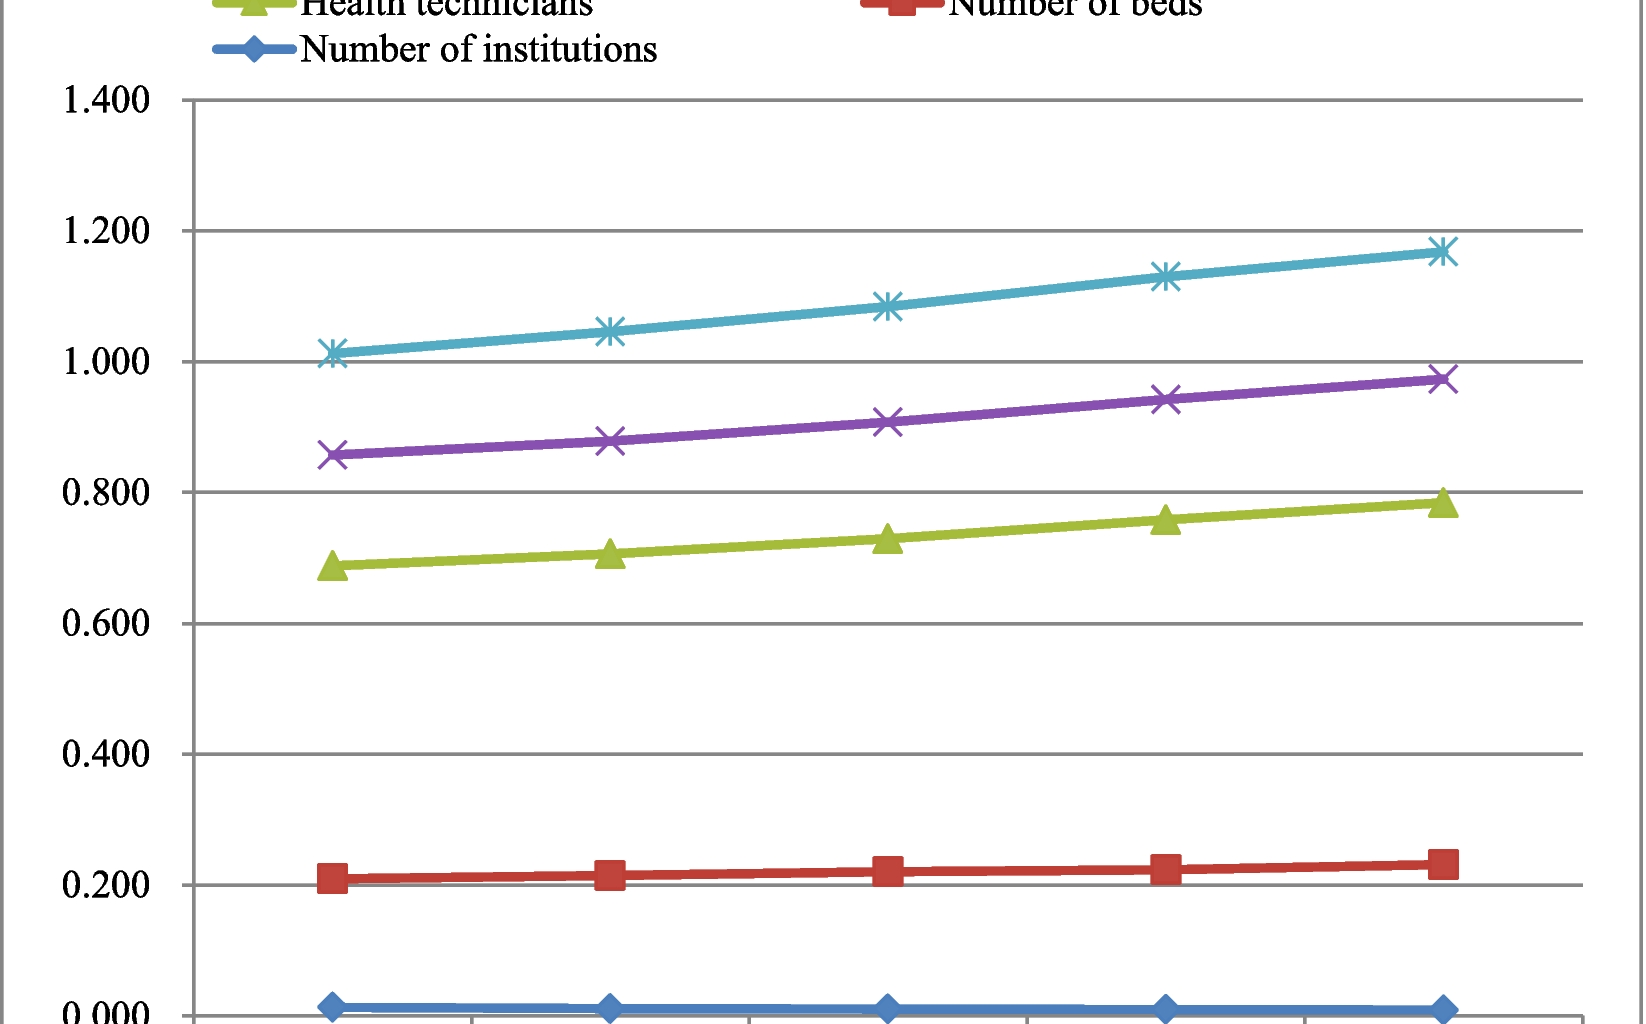
The number of institutions per 1,000 population decreased from 0.013 in 2018 to 0.009 in 2022. The number of beds, health technicians, licensed (assistant) physicians, and registered nurses per 1,000 population increased from 0.196, 0.479, 0.169, and 0.155 in 2018 to 0.222, 0.553, 0.189, and 0.195 in 2022 ( Fig. 1).
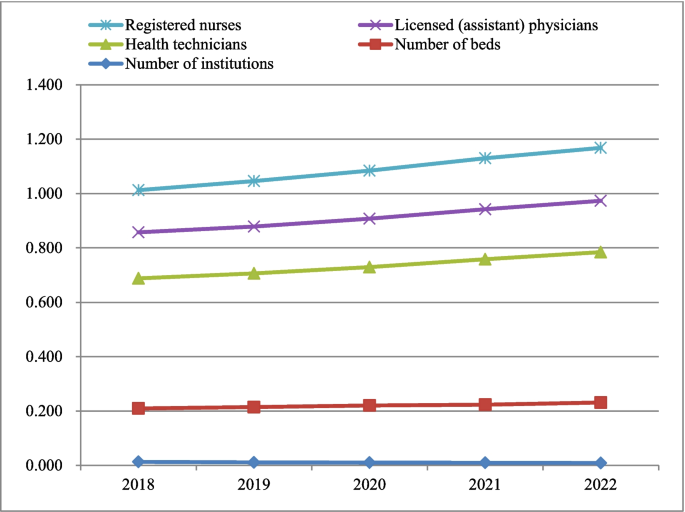
Public health resource allocation per 1,000 population in China
Public health resource allocation per square kilometer
The number of institutions per square kilometer decreased from 0.002 in 2018 to 0.001 in 2022. The number of beds, health technicians, licensed (assistant) physicians, and registered nurses per square kilometer increased from 0.029, 0.070, 0.025, and 0.023 in 2018 to 0.033, 0.082, 0.028, and 0.029 in 2022 ( Fig. 2).
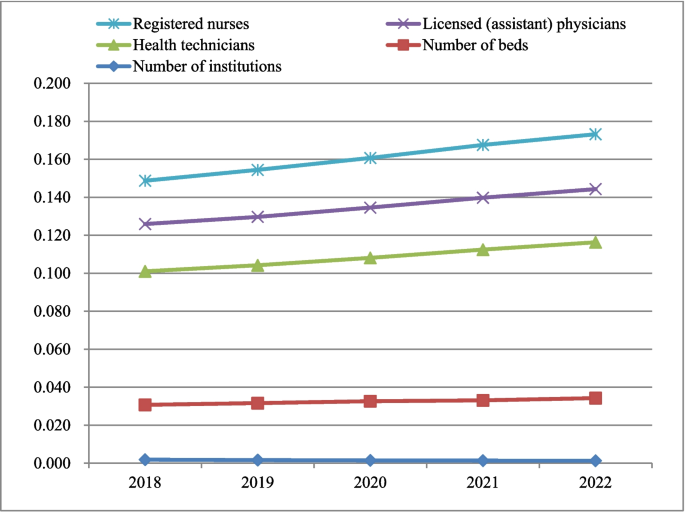
Public health resource allocation per square kilometer in China
Theil index of public health resource allocation by population
The Theil index of public health resource allocation by population ranges from 0.006 to 0.049. The Theil index of the number of institutions shows a decreasing trend, indicating that the equity of the number of institutions is gradually improving. The Theil index of health technicians, licensed (assistant) physicians, and registered nurses shows an increasing and then decreasing trend, indicating that the equity is getting worse and then better. The Theil indexes within regions are smaller than the Theil indexes between regions for the number of beds, health technicians, licensed (assistant) physicians, and registered nurses, indicating that inequity mainly comes from between regions (Table 1).
Theil index of public health resources allocation by geography
The Theil index of public health resource allocation by geography ranges from 0.274 to 0.624, and the Theil index by geography is larger than that by population, indicating that the equity of allocation by geography is slightly worse. The Theil index of the number of institutions shows a decreasing trend, indicating that the equity of the number of institutions is gradually improving. The Theil indices of the number of health technicians and registered nurses show an increasing, then decreasing, then increasing trend, indicating that the equity is getting worse, then better, then worse. The Theil indices within regions are larger than the Theil indices between regions for the number of institutions, the number of beds, health technicians, licensed (assistant) physicians, and registered nurses, indicating that the inequity mainly comes from within regions (Table 2).
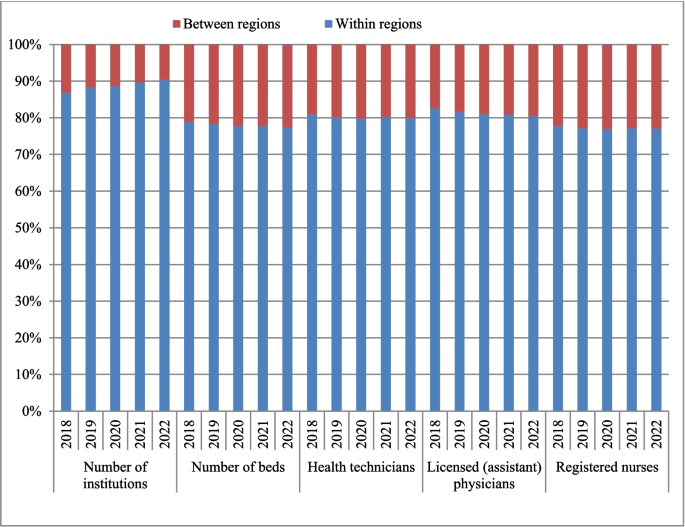
Contribution rate of Theil index of public health resources allocation by population
The contribution rate of the Theil index within region for the number of institutions allocated by population becomes greater than 50% in 2021, indicating that inequality is shifting from between regions to within regions. The contribution rate of the Theil index within region for the number of beds, health technicians, licensed (assistant) physicians, and registered nurses is less than 28.76%, indicating that the inequality mainly comes from between regions ( Fig. 3).
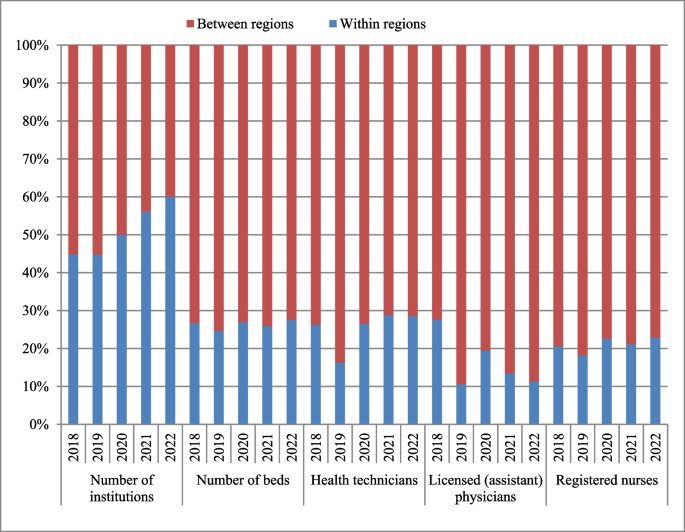
Contribution rate of Theil index of public health resources allocation by population
Contribution rate of Theil index of public health resources allocation by geography
The contribution rate of the Theil index for the number of institutions, the number of beds, health technicians, licensed (assistant) physicians, and registered nurses within regions is greater than 77.05%, indicating that the inequality mainly comes from within regions ( Fig. 4).
Contribution rate of Theil index of public health resources allocation by geography
HRAD of public health resource allocation
The HRAD of public health resources in the northeastern region (excluding the number of institutions) and the western region is less than 1, indicating that public health resources in the northeastern region and the western region are less equitably distributed by geography. The HRAD of public health resources in the eastern region is greater than 2.77, and the HRAD of public health resources in the central region is greater than 2.18, indicating that public health resources in the eastern and central regions are more equitably distributed by geography.
The HRAD/PAD in the northeastern region (excluding the number of institutions) and the eastern region (excluding licensed (assistant) physicians in 2019) is less than 1, indicating that the eastern region and the eastern region overall have insufficient public health resources relative to the agglomeration population. The HRAD/PAD in the central region (excluding the number of institutions, and licensed (assistant) physicians in 2019 and 2021) and the western region (excluding the number of beds in 2018–2019) is greater than 1, indicating that the central and western regions have an excess of public health resources relative to the agglomeration population overall (Table 3).
Efficiency values of public health resource allocation
In 2018, the technical efficiency of public health resource allocation in China is 1, the scale efficiency is 1, the overall efficiency is 1, the return to scale is constant, and the DEA is relatively efficient, indicating that health resource inputs are fully utilized to reach a relatively optimal scale state. In 2019–2022, the technical efficiency of public health resource allocation in China is 1, the scale efficiency and overall efficiency are not 1, the return to scale is decreasing, and the DEA is relatively inefficient, indicating that it is affected by the COVID-19, which reveals problems such as the irrational structure of health resource allocation (Table 4).
Efficiency values and relaxation of public health resource allocation by provincial administrative regions
In 2022, the technical efficiency, scale efficiency and overall efficiency of Tianjin and Tibet are all 1, the returns to scale are constant and the DEA is relatively effective. The scale efficiency and overall efficiency of 29 provincial-level administrative regions, including Hebei and Shanxi, are not 1, with decreasing returns to scale and the DEA is relatively ineffective, indicating that the structure of health resource allocation is irrational (Table 5).
From 2018 to 2021, only Tianjin, Tibet and Qinghai have experienced technical efficiency, scale efficiency and overall efficiency all of which are 1, with constant returns to scale and the DEA is relatively effective. There are 9 provincial-level administrative regions in 2018 and 6 provincial-level administrative regions in 2019 with technical efficiency, scale efficiency and overall efficiency all of which are not 1, with decreasing returns to scale and the DEA is relatively ineffective The technical efficiency, scale efficiency and overall efficiency of 30 provincial-level administrative regions in 2020 and 28 provincial-level administrative regions in 2021 are not 1, the decreasing returns to scale, and the DEA is relatively ineffective, indicating that the structure of health resource allocation is irrational. (Due to space limitations, the efficiency values and relaxation of public health resource allocation by provincial-level administrative regions in China, 2018–2021, are presented in online supplementary appendix 2.)