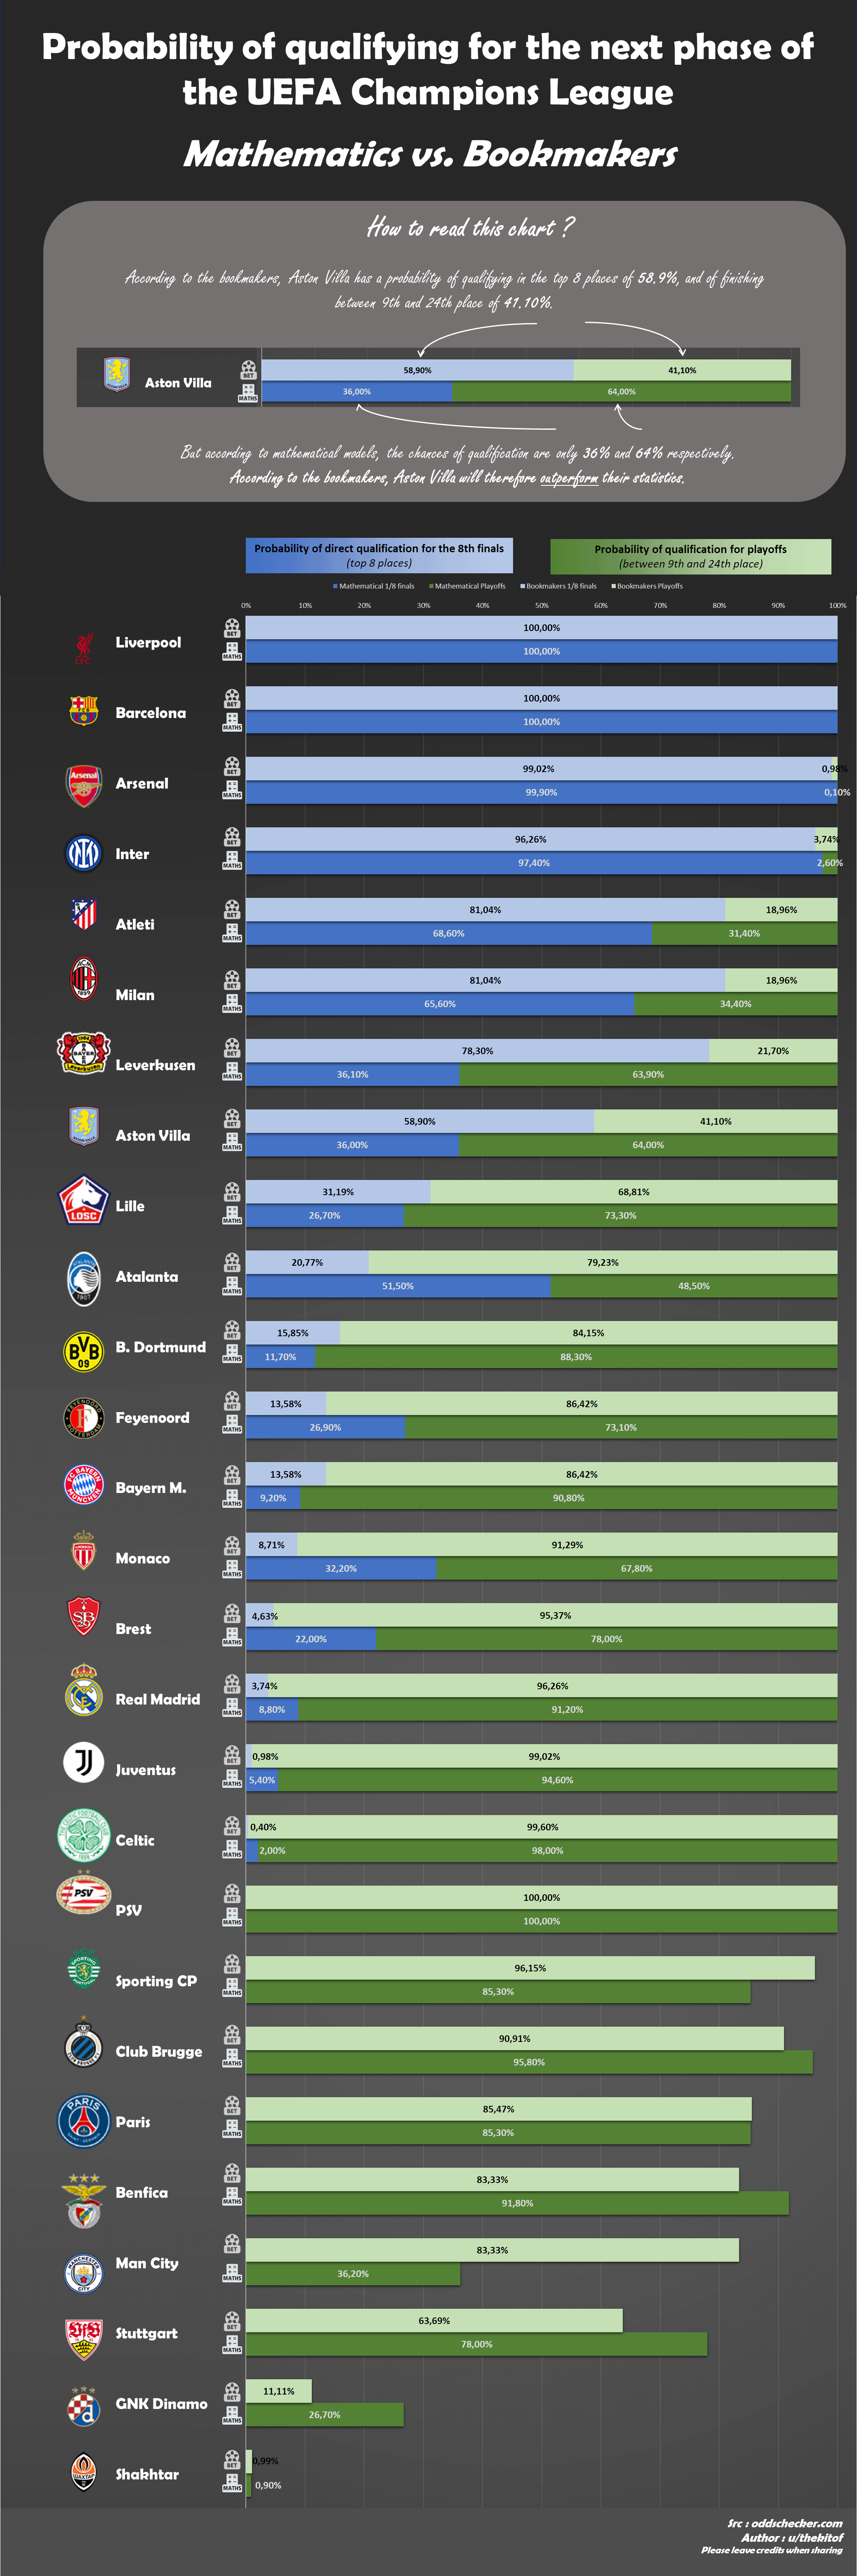
[OC] Probability of qualifying for the next phase of the UEFA Champions League
Mathematics vs. Bookmakers
Posted by TheKitof
![[OC] Probability of qualifying for the next phase of the UEFA Champions League
Mathematics vs. Bookmakers](https://www.europesays.com/wp-content/uploads/2025/01/3rxlo5n4dree1-1920x1024.png)
[OC] Probability of qualifying for the next phase of the UEFA Champions League
Mathematics vs. Bookmakers
Posted by TheKitof
5 comments
Chart produced with :
For [oddschecker.com](http://oddschecker.com) bookmaker data (data from 01/23 at 9am EST, may vary since)
For the mathematical model, simulation of 100,000 matches with a poisson distribution of 1.2 for goals.
Tool: Excel
„how to read the chart“. Maybe if I could read the text I would be able to read the chart.
Manchester City winning at home vs. Club Brugge only has a 36% according to the analytical model?
They’re in poor form but that still seems to call into question the model.
Who or what chose the club names to display?
Bayern M., B. Dortmund
Paris, PSV
Athleti???
Inconsistency at its best.
Definitely worth pointing out that anyone looking at this post should not use it as reason to place bets given the clear flaws in the modelling.
You don’t find many edges of ~50%, if you did, betting would be a lot more profitable for a lot more people.
Comments are closed.