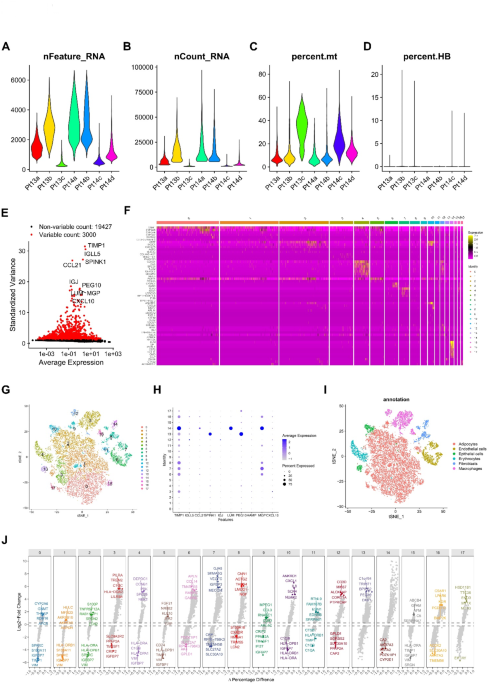
We obtained single-cell sequencing data from the GEO database (GSE112271), comprising seven liver cancer samples for further analysis. Initially, we examined each sample’s nFeature and nCount and calculated the percentage of mitochondrial gene expression relative to total gene expression (Fig. 1A-D). Based on these metrics, we applied stringent filtering criteria (nFeature_RNA > 50 & percent_MT 1E). Principal component analysis (PCA) and t-SNE dimensionality reduction were then performed. Clustering analysis successfully segregated the samples into 17 distinct cell clusters (Fig. 1F, G), with the top 10 heterogeneous genes specifically expressed in these clusters (Fig. 1H). Further annotation revealed six major cell types: adipocytes, endothelial cells, epithelial cells, erythrocytes, fibroblasts, and macrophages (Fig. 1I). A volcano plot visualized the key differential genes between the cell clusters (Fig. 1J). Cluster 3, mainly composed of macrophages, was characterized by differential expression of genes such as PILRA, TREM2, IGFBP7, and CRIP2.
Extraction of macrophage-specific genes and cell-cell communication analysis
Recognizing the critical role of macrophages in liver cancer development, we identified 482 genes closely associated with macrophages (Fig. 2A). Pathway enrichment analysis revealed significant involvement of these genes in tuberculosis, phagosome, and hematopoietic cell lineage pathways (Fig. 2B), predominantly localized to the Golgi membrane and participating in cytokine-mediated signaling pathways (Fig. 2C). A protein-protein interaction network constructed using STRING ranked key genes through Cytohubba’s EPC, Degree, and MNC algorithms on default parameters, with CD4 identified as the central node, followed by FCER1G (Fig. 2D-G). Cell-cell communication networks inferred via CellChat highlighted the importance of the MHC-II signaling pathway mediated by CD4 in macrophage communication (Fig. 2H, I, J, K). Additionally, adhesion molecules such as CD99 and ITGB2, previously identified in pathway enrichment, played essential roles in macrophage interaction with other cells (Fig. 2L, M).
Construction of a prognostic model based on macrophage-specific genes using the LASSO-COX algorithm
To identify macrophage-specific genes with prognostic relevance, we conducted univariate survival analysis, narrowing down 482 genes to 76 (P 3A). Using LASSO regression, we selected 10 key genes—P2RY6, DLGAP3, TNFRSF11A, FCER1G, LAMB1, NCF2, CSF3R, PLA2G7, STC2, and HMOX1—to construct a prognostic risk score (λ = 0.7145) (Fig. 3B, C).
$$\begin{aligned} {\text{RiskScore}}{\mkern 1mu} = & {\mkern 1mu} 0.0{\text{294}} \times {\text{P2RY6}}{\mkern 1mu} + {\mkern 1mu} 0.{\text{1179}} \times {\text{DLGAP3}}{\mkern 1mu} + {\mkern 1mu} 0.0{\text{3}}0{\text{7}} \times {\text{TNFRSF11A}}{\mkern 1mu} \\ & + {\mkern 1mu} 0.000{\text{5}} \times {\text{FCER1G}}{\mkern 1mu} + {\mkern 1mu} 0.000{\text{5}} \times {\text{LAMB1}}{\mkern 1mu} \\ & + {\mkern 1mu} 0.00{\text{28}} \times {\text{NCF2}} + {\mkern 1mu} 0.00{\text{21}} \times {\text{CSF3R}}{\mkern 1mu} + {\mkern 1mu} 0.00{\text{28}} \times {\text{PLA2G7}}{\mkern 1mu} \\ &+ {\mkern 1mu} 0.00{\text{53}} \times {\text{STC2}}{\mkern 1mu} + {\mkern 1mu} 0.000{\text{2}} \times {\text{HMOX1}}. \\ \end{aligned}$$
Heatmap analysis revealed generally consistent expression patterns for the selected genes, except for RAMP3 (Fig. 3D). Comparative survival analysis indicated significantly higher mortality in the high-risk group compared to the low-risk group (Fig. 3E). The model’s prognostic performance was assessed using ROC curves, with AUC values of 0.78, 0.72, and 0.71 for 1-, 3-, and 5-year survival, respectively (Fig. 3F). A nomogram combining clinical parameters with the risk score was developed to predict 1-, 3-, and 5-year outcomes (Fig. 3G). KM analysis indicated worse outcomes for patients with higher nomogram scores (Fig. 3H), and further ROC analysis showed improved AUC values of 0.79, 0.78, and 0.78 for 1, 3, and 5 years, respectively (Fig. 3I). Calibration curves confirmed the model’s robust predictive performance, and also suggested that the 1-year survival rate would be overestimated, while the 3- and 5-year survival rates would be underestimated in the survival prediction of low-risk populations (Fig. 3J).
Immune landscape of the risk score model
We explored the association between the risk score and immune cell types by analyzing 22 immune cell populations using the CIBERSORT algorithm. The results revealed correlations between the risk score and macrophages, monocytes, and resting mast cells (Fig. 4A). Significant differences were also observed in T cells, macrophages, monocytes, and resting mast cells between high- and low-risk groups (Fig. 4B). High-risk patients exhibited significantly higher tumor stemness scores compared to low-risk patients (Fig. 4C), while MSI and TMB scores showed no differences (Fig. 4D, E). Immunotherapy response analyses using ESTIMATE and TIDE algorithms revealed a lower stromal score in the high-risk group (Fig. 4F) and reduced “Merck 18” score and expected immunotherapy response (Fig. 4G, H). Additionally, immune checkpoint markers such as IL1A, IL12A, CD80, TNFRSF18, SELP, IL1B, HAVCR2, and CD276 were significantly associated with the risk score (Fig. 4I).
Prognostic and single-cell analysis of risk score genes
To further elucidate the role of the 10 risk score genes in hepatocellular carcinoma (HCC), Kaplan-Meier (KM) survival analysis was conducted to assess their association with patient outcomes. The results demonstrated that patients in the TCGA cohort could be effectively stratified based on the expression levels of these genes, with significant differences in prognosis (Fig. 5A). Additionally, single-cell t-SNE expression heatmaps revealed distinct expression patterns for all 10 genes, with FCER1G showing the highest expression level and concentration (Fig. 5B). To gain deeper insights into their roles in cellular development, we conducted pseudotime analysis across six annotated cell types (Fig. 5C). Focusing specifically on the macrophage developmental trajectory, we identified four distinct developmental stages within the macrophage population (Fig. 5D, E). The top 10 differentially expressed genes along this trajectory were highlighted, including ALB, APOA2, HP, RBP4, TTR, APCS, GSTA2, HULC, TMSB4X, and TYROBP (Fig. 5F). Among the risk score genes, PLA2G7, HMOX1, and FCER1G were found to closely align with macrophage developmental pathways, suggesting their critical involvement in macrophage differentiation and function (Fig. 5G).
Bioinformatics analysis of FCER1G’s potential role in HCC
FCER1G (Fc Epsilon Receptor Ig) is a tetrameric protein-coding gene (Fig. 6A) whose protein and RNA levels were significantly downregulated in HCC tumor samples (Fig. 6B, C). Abnormal phosphorylation modifications at sites such as S61, Y65, T66, T75, and Y76 were observed in HCC tumor samples (Fig. 6D), despite no differences in immunohistochemistry results (Fig. 6E). STRING analysis revealed FCER1G’s interactions with MAPK signaling pathway proteins, JAK family proteins, and leukocyte differentiation antigens (Fig. 6F). Gene mutation landscape analysis showed that the low expression group of FCER1G had a higher mutation frequency of genes such as TP53, SDK1, and NBEA, while the high expression group had a higher mutation frequency of genes such as AXIN1, OR2J3, and MYH11 (Fig. 6G). In addition, the transcription level of FCER1G was also associated with various pathways, including apoptosis, ferroptosis, TP53 pathway, PI3K/AKT pathway, tumor inflammatory response, etc. ( Fig. 6H ).
Inhibition of FCER1G expression enhances proliferation and migration of HepG2 cells
To investigate FCER1G’s role in HCC, we knocked down its expression using si-FCER1G, confirmed by real-time PCR (Fig. 7A). Cell viability assays (CCK-8) and colony formation experiments demonstrated that FCER1G suppression enhanced HepG2 cell proliferation (Fig. 7B, C). Additional, parallel experiments in Huh7and PLC/PRF5 also confirmed this finding (Fig. 7D-G). EMT marker analysis revealed that si-FCER1G increased Snail 1, TWIST 1, and N-cadherin expression, while reducing E-cadherin levels, promoting cell migration (Fig. 7H). This was confirmed by wound healing assays, which showed accelerated wound closure in si-FCER1G-treated HepG2 cells (Fig. 7I).