-
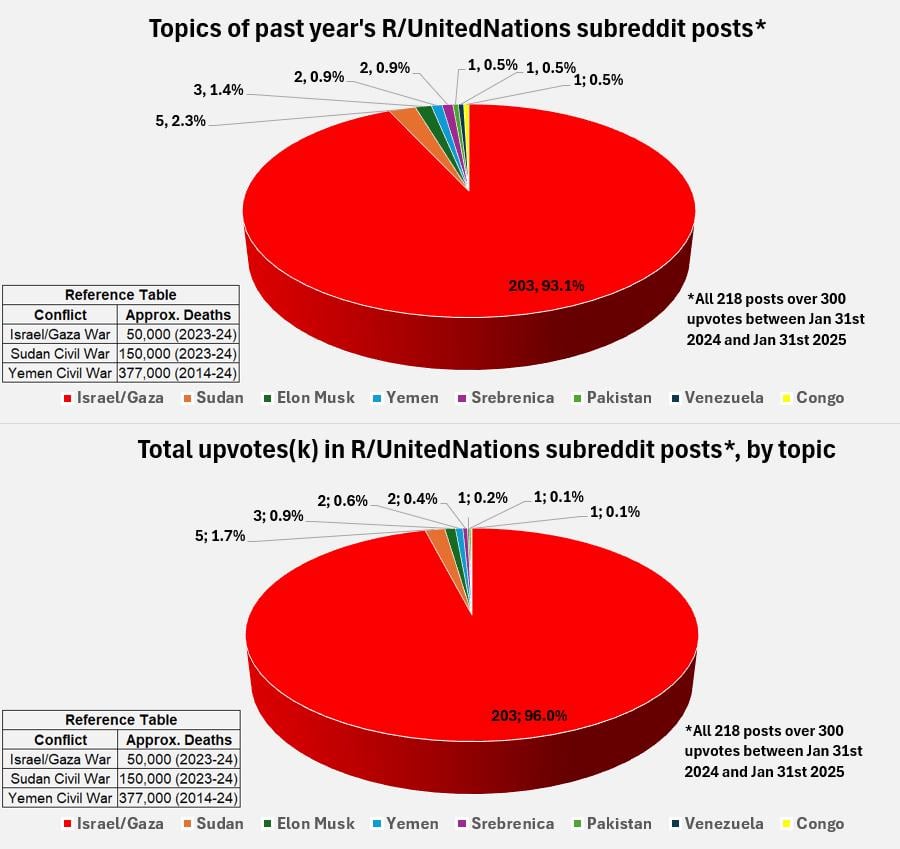
Analysed 218 posts in R/UnitedNations that achieved over 300 upvotes from Jan 31st 2024 and Jan 31st 2025
-
Posts were so extremely brigaded on one topic that I added a reference table for objective conflict casualties (even if they do not fit the exact date range).
Posted by RBZRBZRBZRBZ
9 comments
I’m a simple person. I see a 3D pie chart, I downvote.
Smells like an obsession…
If people act like they cant clearly see how antisemitic the amount of hate and coverage the Israeli- Gaza war is getting, they are either dishonest or antisemitic themselves.
I don’t think people really care about us, at least not the vast majority of them.
the few who have feelings (*feelings* it’s rarely thoughts) about this are really loud. The rest are bots run by organizations with a keen interest (some of the posts are so brain dead, it’s so not funny anymore it goes back to being funny).
The dating is very debatable. Israel/Gaza goes back to 1948 or so, more or less continuously. All of the states listed have history well outside of just the last few years, none of it occurs in isolation.
The only really weird one is Musk.
Not a single russia – ukraine war post? Damn This feels like someone is artificially promoting a particular topic of posts just like twitter
Would also be interesting to look at the frequency pre/post US election
“There is no data that can be displayed in a pie chart that can not be displayed better in some other type of chart.”
John Tukey
I agree with the sentiment. It’s a terrible plot though IMO. It should be a scatterplot, x=deaths y=posts to show what a massive outlier gaza is.
This is a bad plot. 3d pie charts are horrible and topically made by people who have never worked with data before.
Also I think it’s because it’s more contentious right? Israel a modern democracy after a terrorist attack went full blitzkrieg on Gaza.
Comments are closed.