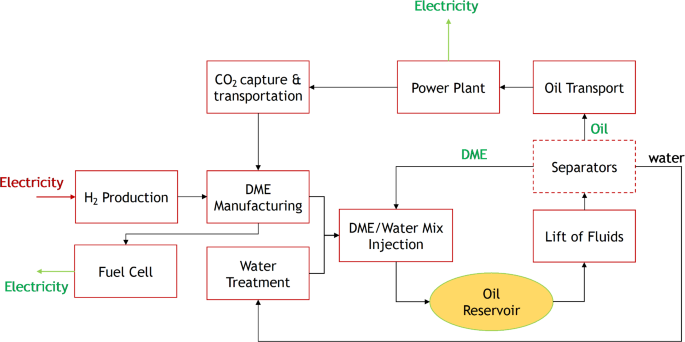
In the DME EOR process, it is common to inject significant volumes of solvents into subsurface formations to displace and recover oil. Figure 2 presents the oil production data, which is utilized to assess whether the produced oil from the field, along with the resulting CO2 emissions from the power plant, can generate the necessary volume of DME required for the field operations. To determine the amount of CO2 generated by burning oil, a stoichiometric balance is employed. Oil is assumed to be CH2 with the combustion reaction:
$$2C{H_2}+{3O_2} \to 2C{O_2}+2{H_2}O$$
(8)
According to Eq. (8), burning 1 kg of CH2 releases 3.14 kg of CO2. With a CO2 capturing efficiency of 90%, 10% of the produced CO2 in the power plant will be emitted to the atmosphere. According to Eq. (2), 1.91 kg of CO2 is needed to produce 1 kg of DME, therefore, the minimum amount of the manufactured DME per barrel of oil can be calculated as
$$\begin{aligned} 1~bbl & – oil \times 0.159\frac{{{m^3} – oil}}{{bbl – oil}} \times 885\frac{{kg – oil}}{{{m^3} – oil}} \times 3.14\frac{{kg – C{O_2}}}{{kg – oil}} \\ & \; \times 0.90 \times \frac{1}{{1.91}}\frac{{kg – DME}}{{kg – C{O_2}}}=208.2~kg – DME \\ \end{aligned}$$
(9)
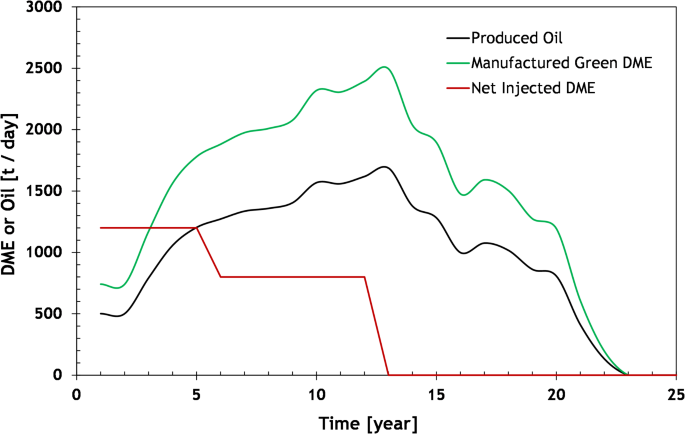
Based on the analysis, it is observed that approximately 0.21 tons of DME (equivalent to 1.48 kg-DME/kg-oil) can be produced from every barrel of oil burned in the power plants. Figure 3 illustrates the total producible DME using the hydrogenation method, considering the oil production data presented in Fig. 2. Except for the first two years, the DME production is sufficient to meet the field’s requirements. The surplus DME can be utilized in other fields or for various purposes, such as electricity generation, methanol production, or transportation.
Power requirement to manufacture DME
The estimated maximum installed capacity needed to supply the power required for producing approximately 3000 tons per day of DME (as shown in Fig. 3) is around 2.5 GW, based on an energy requirement of 74 MJe/kg-DME. In recent years, solar and wind power have accounted for over 60% of the installed capacity from renewable energy sources, which amounts to around 3300 GW globally42. This growth has been primarily driven by significant investments in solar power. In the Middle East and North Africa region, where there is abundant sunlight, there has been a notable increase in solar PV investments. As of 2022, approximately 16 GW of power is produced using solar PV in the Middle East, and this number is expected to rise rapidly to over 35 GW by 202642.
However, a challenge lies in obtaining the required capacity from a single solar farm. Currently, the largest solar farm in the UAE has an installed capacity of around 1.0 GW, which is projected to increase to 5 GW by 2030. While the capacity in the region is expected to grow, meeting the energy requirements of the DME EOR project would likely necessitate sourcing from multiple solar farms. Furthermore, it is important to note that the estimated installed capacity of 2.5 GW assumes that all the captured CO2 is used for DME production, which exceeds the requirements of the field. Depending on availability, a lower installed capacity may be sufficient to meet the field’s needs. For instance, to produce the net DME requirement of 1200 tons per day (as shown in Fig. 3), an installed capacity of 1 GW would be necessary. Alternatively, dividing the DME EOR project into several smaller projects could be considered to reduce the size of the initial investments.
Exergy balance
This section presents the findings of the exergy analysis conducted on the DME-EOR process with the system depicted in Fig. 1 and input parameter in Table 1. Figure 4 depicts the history of the exergy-recovery-factor (ExRF) for the scenario where the produced oil and excess DME are converted into electricity. The injection of DME leads to additional oil production until year 13; however, this necessitates the manufacturing of large volumes of DME. Due to the significant exergy involved in DME synthesis, the amount of invested exergy is considerably greater than the recovered exergy. Consequently, the overall ExRF for the process is negative.
Nevertheless, after year 13, the ExRF starts to increase and becomes positive as the volume of back-produced DME is sufficient to meet the injection requirements. By the end of year 20, there is no DME injection or oil production, resulting in no exergy being used for DME synthesis. The injected DME is fully recovered even after oil production ceases. The cumulative Energy Return on Energy Invested (ERoEI) for the entire process reaches 0.34 at the project’s conclusion, indicating an overall exergetic efficiency of 34%, as depicted in Fig. 4.
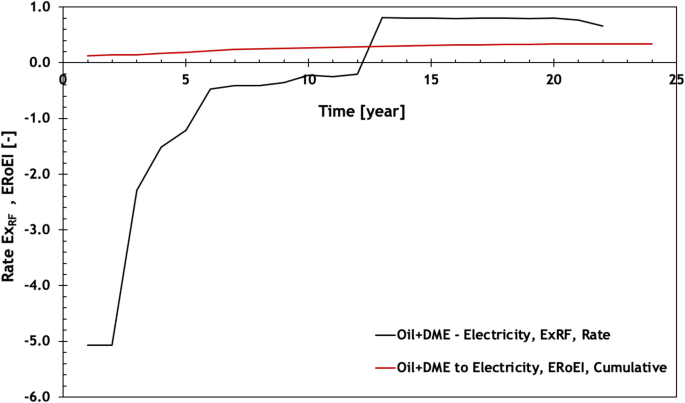
Rate exergy recovery factor (defined in Eq. 3) and cumulative ERoEI as functions of time for the case where the produced oil and the excess DME are converted to electricity. The resulting CO2 assumed to be captured.
Figure 5 illustrates the distribution of the invested exergy among different components of the system depicted in Fig. 1. As shown in Fig. 5, during the initial phase of the project, the exergy required for DME synthesis accounts for approximately 80% of the total invested exergy until year 13 when the net injected DME reaches zero. During this period, CO2 capture consumes less than 20% of the total invested exergy. However, once the back-produced DME from the reservoir is sufficient to sustain oil recovery, the exergy investment in CO2 capture and transport becomes the largest. This trend continues until year 20 when oil production ceases, resulting in no CO2 emissions and, consequently, no exergy required for CO2 capture.
After this point, the lift and injection pumps become the primary exergy consumers, accounting for approximately 50% and 30% of the total exergy investment, respectively. It is important to note that after oil production stops, water is injected to recover the retained DME in the reservoir. The contribution of oil transportation to the overall exergy invested is minimal and does not have a significant impact. Figure 5 also reveals a general increase in the exergy investment associated with oil and water. This is attributed to the increasing oil production over time. Additionally, the exergy investment related to lift and injection pumps and water treatment increases due to the larger volume of injected water required for back-producing the injected DME. However, the magnitude of this increase is not comparable to the exergy invested in DME synthesis and CO2 capture from the power plant. The corresponding Sankey diagram of the process is plotted in Fig. 6 for year 5 of the injection.
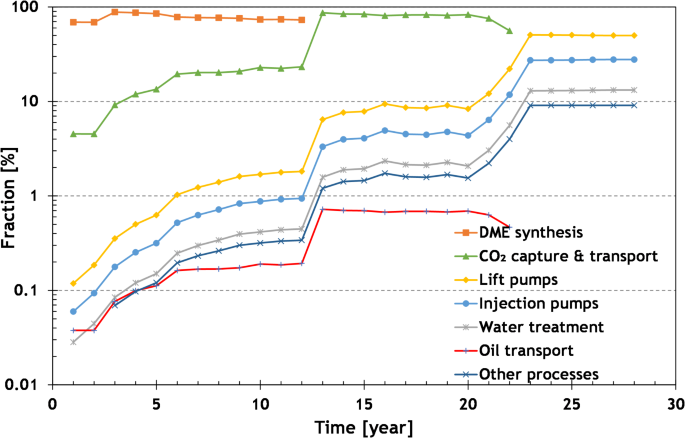
Fractions of the invested exergy in different Components of the considered system in Fig. 1.
Figure 6 further illustrates the CO2 intensity of the DME-EOR process over time, particularly in terms of specific emission reduction performance, measured in kg-CO2/bbl-oil. This includes CO2 emissions from DME synthesis, injection, and production operations, as well as the oil-fueled power plant. The reservoir oil has a calculated CO2 intensity of approximately 442 kg-CO2/bbl-oil. With a 90% CO2 capturing efficiency, the dashed red line in Fig. 6 represents the emission of 44.2 kg of CO2 for every barrel of oil consumed in the power plant. Most the total CO2 emissions is attributed to the manufacturing of the required DME, particularly in the early stages of the project. To reduce this emission, efforts can be made to lower the carbon footprint of the exergy needed for CO2 capture and H2 production. In this study, it is assumed that solar energy with a specific CO2 emission of 12.5 gr-CO2/MJe is used to supply the exergy for DME synthesis. The field equipment operates on electricity generated from gas turbines.
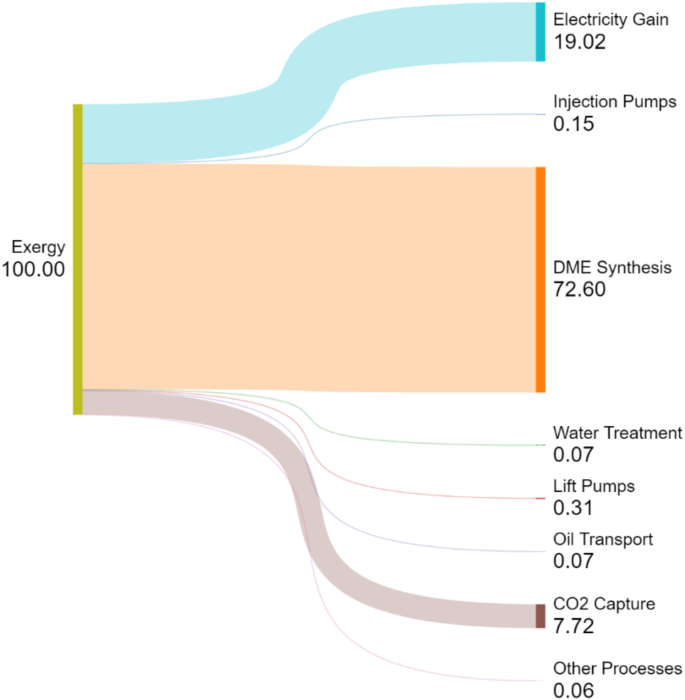
Sankey diagram of the DME EOR process at time = 5 years.
In summary, Fig. 7 presents the cumulative CO2 intensity of the process and the fraction of abated CO2 Over time, the cumulative CO2 intensity decreases, and by the end of the project, with the assumptions made in this paper, it is reduced to less than 50 kg-CO2/bbl-oil. This means that approximately 74% of the CO2 resulting from burning the produced oil is prevented from entering the atmosphere. If zero-carbon electricity is used throughout the entire process, the total abated CO2 can reach 85%.
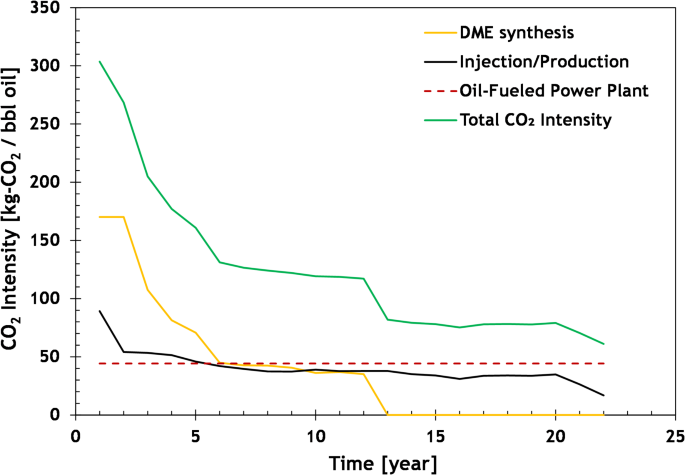
CO2 intensity of the low-carbon DME-EOR process (Fig. 1) as a function of time.
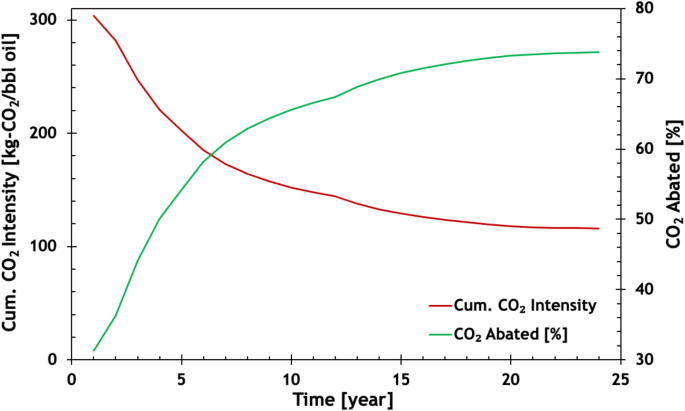
Cumulative CO2 intensity of the low-carbon DME-EOR process and the percentage of the abated CO2. The CO2 intensity of burning oil is 442 kg-CO2/bbl oil.
Figure 8 presents a comparison of the CO2 intensity between the electricity generated in the system of Fig. 1 and the oil produced through water injection, with CO2 capture considered in both cases. Following refs.40,41. the CO2 emissions of the water-injection project is
$$\:{e}_{C{O}_{2},WF}=\frac{a}{1-{f}_{w}}$$
(10)
Here, fw represents the overall water cut of the reservoir, and the factor a (kg-CO2/m3-water) represents the CO2 emission associated with handling the injected water. For water cuts of 95% and 98%, CO2 intensities of 25 and 64 kg-CO2/bbl oil are calculated, respectively. Assuming a 90% CO2 capture efficiency and a 40% power plant efficiency, the CO2 intensity of the electricity is calculated to be 30 and 47 g-CO2/MJe, respectively. It is worth noting that the emitted CO2 for the low-carbon DME EOR is lower (approximately 33% for fw = 0.95 and 65% for fw = 0.98) compared to the water flooding case. This difference is more pronounced in the initial stages of the project, as less energy is required for DME manufacturing due to lower oil production. The exergetic efficiency of the DME-EOR process starts off relatively low but reaches about 80% by the end of the project.
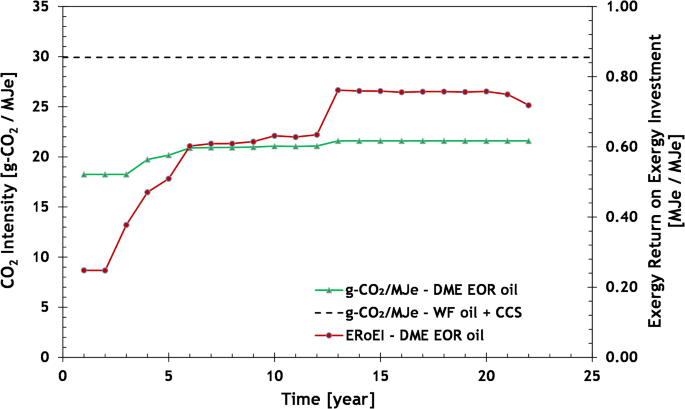
CO2 intensity of the electricity generated from the system considered in Fig. 1. The black dashed line is the CO2 intensity of the oil production from waterflood project with 95% water cut. Both cases consider Carbon Capture and Storage (CCS) option. The red is the exergetic efficiency of the low-carbon DME EOR process.
Figure 9 illustrates the relationship between the DME utilization factor (bbl-oil / tDME) and the total emitted CO2 per barrel of oil in the DME-EOR process. DME utilization factor is defined as the volume of oil produced per mass of DME injected. Utilization factor in (CO2 and chemical) enhanced oil recovery is a good indicator of the efficiency of injectants in extracting oil. The utilization factor usually.
The DME utilization factor is quantitatively defined as the volume of oil produced per unit mass of DME injected into the reservoir. The utilization factor is commonly used to evaluate efficiency of injectants in (CO2 and chemical) EOR projects and is influenced by the physicochemical properties of the reservoir, degree of reservoir heterogeneity, thermodynamic conditions (pressure, temperature, salinity), the type of injectant, the characteristics of the crude oil, the interaction between the injectant and the reservoir rock, and the operational parameters of the injection process.
The CO2 emissions considered in Fig. 10include the 10% of CO2 released from burning oil (with 90% of the released CO2 captured) as well as the CO2 emissions from DME synthesis and injection. As shown in this figure, the DME utilization factor significantly impacts the life-cycle analysis of the DME-EOR process, like the CO2 EOR process (Farajzadeh et al., 2020). Improving the DME utilization factor can be achieved by enhancing the mobility control between the injected DME solution and the in-situ oil. One approach to achieve this is by adding polymers into the DME solution9. Under favorable conditions, such as a DME utilization factor of 20 bbl/tDME, the total CO2 intensity of oil decreases to less than 30 kg-CO2/bbl oil. This indicates that more than 93% of the resulting CO2 from burning oil can be abated. This is a significant reduction compared to other EOR methods. In particular, with typical utilization factors of 2–4 bbl-oil/tCO2, CO2 EOR reduces CO2 intensity of oil by 75–80%7.
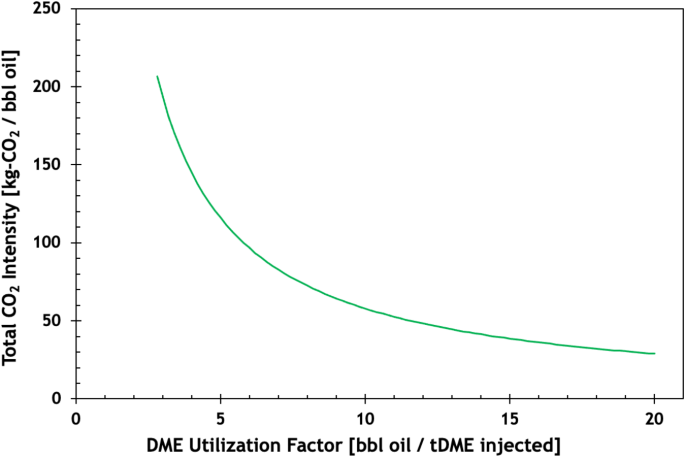
Total CO2 intensity of a barrel of oil produced as a function of DME utilization factor. The numbers include CO2 emissions from burning oil and CO2 released from synthesis of DME.