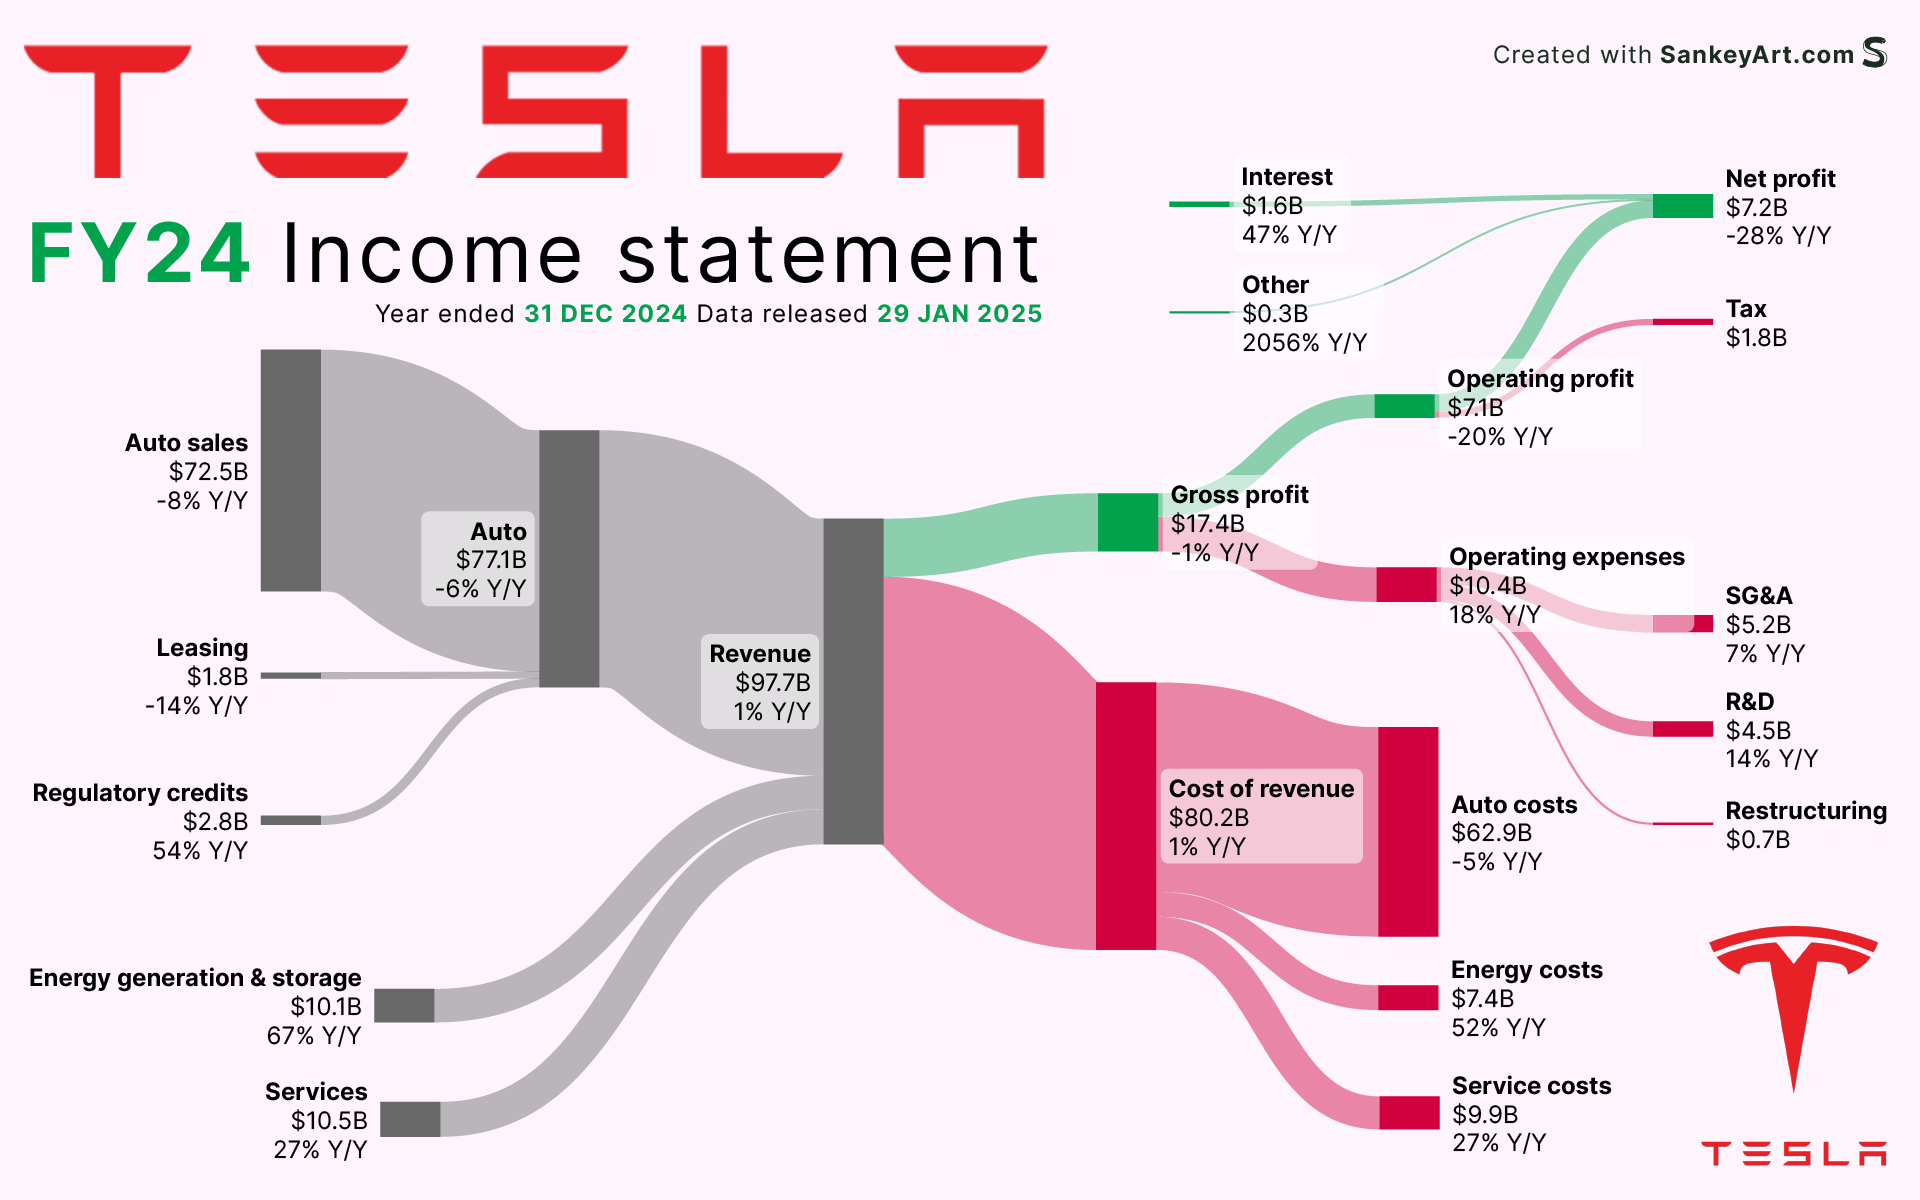
[OC] Tesla’s full year earnings visualized Posted by sankeyart Tags:DataData Is BeautifulDataIsBeautiful 17 comments Source: [Tesla investor relations website](https://www.sec.gov/Archives/edgar/data/1318605/000162828025003063/tsla-20241231.htm) Tool: [SankeyArt](http://sankeyart.com) sankey diagram maker So…net profit down 28% YOY. this graphic is clever in the way it tries downplay that. This year’s going to be much worse for Tesla. If we all join in and work together, we can get those numbers way down by boycotting Tesla and relentlessly protesting outside of their dealerships. Crazy MC for lackluster performance Too much green; let’s bring those numbers down. At this rate it will take Tesla well over 100 years to generate 1 trillion in profit. Yet it’s already a trillion dollar company with negative growth. 82% cost revenue?? Those are some ugly margins. Where’s the Bitcoin sales? That was half a billion at least. Your sankey is looking a little chubby ‘Other’… 0.3…. whats the point of even includi….. ohhhhh… that little line is $300,000,000. Jesus. This is a beautiful chart! Will someone enlighten me… if every car they sell, they charge tax on, shouldn’t they be paying more in taxes on revenue from auto sales? It’s a 1.5 Trillion dollar company the feee cash flow model does not seem to apply here This visualization makes Elon Musks $56 billion proposed pay package even more absurd, basically 8 full years of net profit to a single executive. 2.2b in govt credits???? DOGE WHERE YOU AT? More coming in in Regulatory Credit than going out in Taxes. Comments are closed.
Source: [Tesla investor relations website](https://www.sec.gov/Archives/edgar/data/1318605/000162828025003063/tsla-20241231.htm) Tool: [SankeyArt](http://sankeyart.com) sankey diagram maker
If we all join in and work together, we can get those numbers way down by boycotting Tesla and relentlessly protesting outside of their dealerships.
At this rate it will take Tesla well over 100 years to generate 1 trillion in profit. Yet it’s already a trillion dollar company with negative growth.
Will someone enlighten me… if every car they sell, they charge tax on, shouldn’t they be paying more in taxes on revenue from auto sales?
This visualization makes Elon Musks $56 billion proposed pay package even more absurd, basically 8 full years of net profit to a single executive.
![[OC] Tesla's full year earnings visualized](https://www.europesays.com/wp-content/uploads/2025/02/5u8nsegwu7he1-1920x1024.png)
17 comments
Source: [Tesla investor relations website](https://www.sec.gov/Archives/edgar/data/1318605/000162828025003063/tsla-20241231.htm)
Tool: [SankeyArt](http://sankeyart.com) sankey diagram maker
So…net profit down 28% YOY. this graphic is clever in the way it tries downplay that.
This year’s going to be much worse for Tesla.
If we all join in and work together, we can get those numbers way down by boycotting Tesla and relentlessly protesting outside of their dealerships.
Crazy MC for lackluster performance
Too much green; let’s bring those numbers down.
At this rate it will take Tesla well over 100 years to generate 1 trillion in profit. Yet it’s already a trillion dollar company with negative growth.
82% cost revenue?? Those are some ugly margins.
Where’s the Bitcoin sales? That was half a billion at least.
Your sankey is looking a little chubby
‘Other’… 0.3…. whats the point of even includi….. ohhhhh… that little line is $300,000,000. Jesus.
This is a beautiful chart!
Will someone enlighten me… if every car they sell, they charge tax on, shouldn’t they be paying more in taxes on revenue from auto sales?
It’s a 1.5 Trillion dollar company the feee cash flow model does not seem to apply here
This visualization makes Elon Musks $56 billion proposed pay package even more absurd, basically 8 full years of net profit to a single executive.
2.2b in govt credits???? DOGE WHERE YOU AT?
More coming in in Regulatory Credit than going out in Taxes.
Comments are closed.