I posted a similar chart a few weeks ago and several people wanted see how federal employment compares to the US population. I chatted with some folks here and landed on using a similar measure: federal employment compared to the size of the entire US workforce.
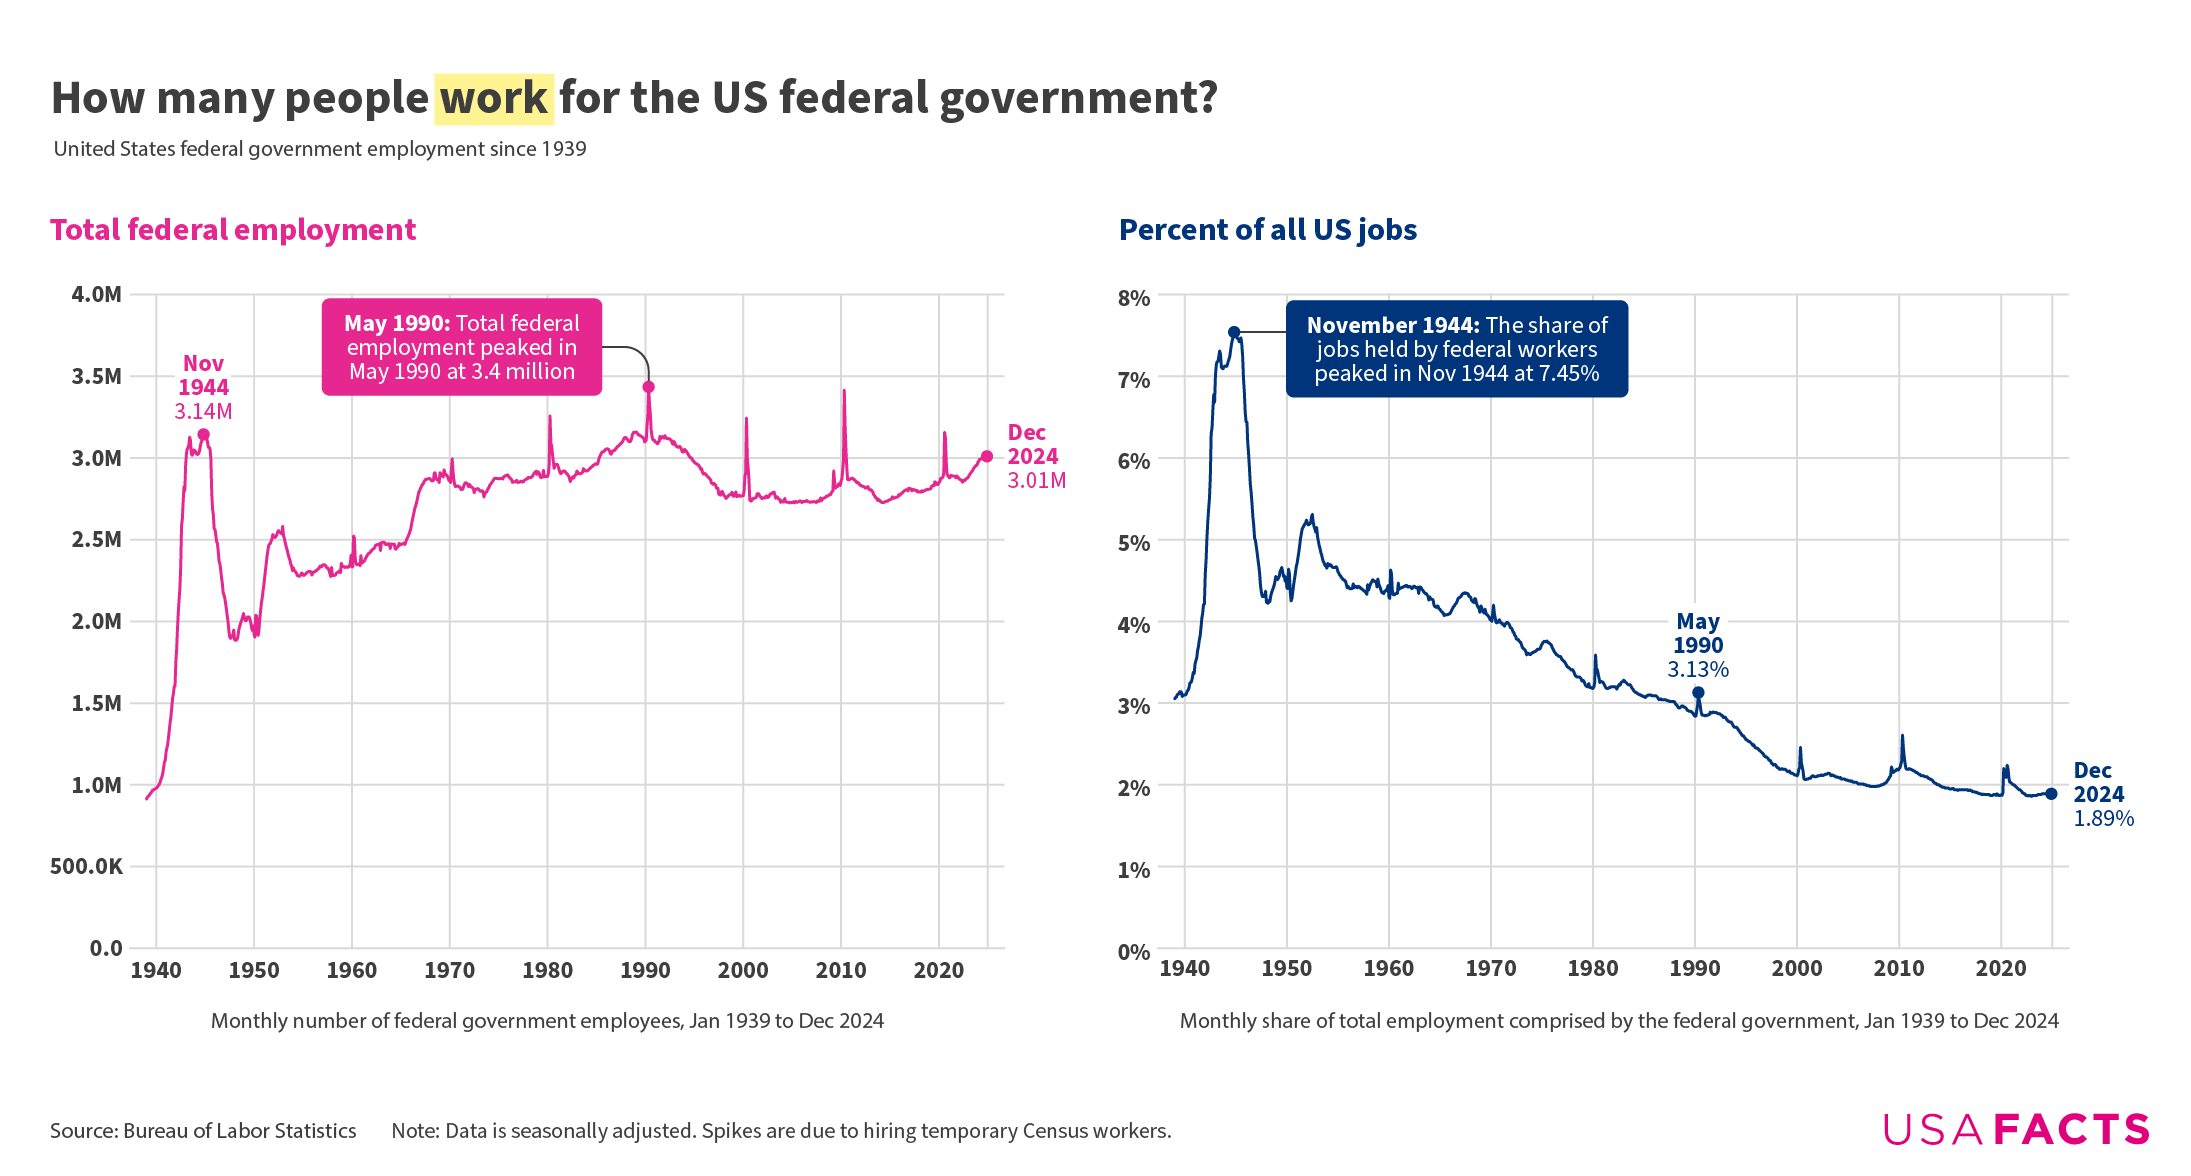
Federal government workers per capita shows that there are about as few as there ever have been in the post-WWII era.
But Fox News told me the government is a massive wasteful juggernaut that keeps growing!
A few things I find interesting:
Reagan ran on smaller government, but it only increased during his time. Maybe military? Just looked it up and during the 80’s about 75% of federal workers were military related. It’s now around 50%. Makes sense with the cold war ending.
Besides census years, it looks like it’s remained pretty steady at around 2.75 million, with a recent jump to 3 million.
A funny thing happened in the early 40’s…
So, the federal governement is in-efficient because they have less man-power. Who would’ve thunk.
Does this include contractors? If not this is pointless.
needs to be lower. Lean and mean machine
I guess the Xgovernment will gladly do what your current govermant can’t. Democracy secured.
Government employees are only part of the picture. Full-time government contractors exceed the number of civil service employees.
US economy and free market is literally insane
in other countries this rate is like 10% usually, can go up to 25% in commie or regulated countries, and trump is cutting it even further
amazing sight to behold, be proud burgerians, this is unprecedented levels of success
Meanwhile, US Government spending as a fraction of GDP keeps going up. If it’s not direct headcount costs, then it’s indirect. That would make this direct employment chart is disengenuous — it’s like Walmart saying “we have 1,000 employees, but we have 100,000 contractors.”
Need a graph separating military and including contractors
Plot against the R and Ds perception of what percentage.
IMO – any reasonable organization needs 5-10% overhead costs – running the county is no different.
Its amazing how computers and automation have made people more efficient and in spite of that, if I want to provide documents to the IRS my options are to mail or fax a document.
Its not surprising the percentage has dropped, most government employees not in the postal service or military are white collar workers. We should see these jobs becoming more efficient, its just not efficient enough considering the technology available. Anyone who has delt with the IRS, Social Security Administration, Medicare/Medicaid, etc. knows exactly how inefficient, slow, bureaucratic, and backwards these agencies are compared to walking into literally any other business short of health insurance.
Disagree? Just try calling into the IRS or SSA and lmk how that goes.
This is a pointless comparison. Government’s function has nothing to do with business.
Holy hell 3 million people in the federal government alone?!?! I thought it was less than 2.. which is still crazy
Doesn’t look so “bloated” after all, does it?
*Christian Bale American psycho meme*
Very nice. Now include contractors and non-profits using federal grant money.
A reporter asked the Hoover Dam Project Leader how many men he had working on site. He answered, “About a third of ’em.”
Meaningless. Over 10% of the Federal budget is spent on contractors, while employee salaries comprise around 7%. The actually important figure is *spending*, as a percentage of the entire U.S. economy, and relative to tax receipts.
So, what you’ll find is that in spite of “massive” tax cuts, the overall percentage of American GDP taken in taxes has remained reasonably steady at around 16% for the past 80 years. Meanwhile, government outlays as a percentage of GDP have climbed steadily higher, going from around 17% in the 1960’s to 23% today.
So the money we spend keeps going up, and the money we take in taxes remains stubbornly flat.
Where is all the money going then? Inflation adjusted expenditures looks very different.
Cool, I wonder what state gov numbers would look like.
Is there a chart that shows the monthly share of the total population employed by the federal government?
So, Republicans have been getting what they wanted for the past 50 years and STILL they play the victim.
Hmm, but why start at 1939 when the gov already exploded in size due to the „new deal“ etc?
Would be nice to see the 19th century too.
Hmm, but why start at 1939 when the gov already exploded in size due to the „new deal“ etc? Would be nice to see the time before that too.
The thing that conservatives don’t understand (and/or don’t want you to understand) is that most government workers actually do something necessary. The last time the U.S. seriously slashed government workers, under Clinton in the 90s, all that happened was that contractors were brought in to do the work instead, and contractors cost more. Also as these charts show, we haven’t had any real growth in government workers in decades.
If you want to really go after waste, you need to do things like hit the Department of Defense and allow things like Medicare negotiating drug prices. Elon Musk’s “savings” are just intended to throw more money at billionaires and corporations. A few genuine “savings” might be found by slashing enforcement of things like clean air and clean water laws, but we’ll all pay for that in different ways.
Ironically, the best way to save the government money would probably be to reduce the use of contractors and hire *more* government employees, and the best way to improve the top line of the federal budget would be to hire more auditors for the IRS and have them go after the rich.
Of course Elon Musk is never going to do that, because his goal isn’t to improve the federal budget.
We have 3.1 million federal workers now as we did 40 years ago, 30% of them are veterans. That’s about 1 million vets.
Like $15 billion in contracts to Musk.
What’s funny is smaller government is more expensive, and excessively so. 2011 report of contractors (how government can make itself “smaller”) shows that government contractors cost 1.8-2x the cost of a federal employee. So privatization costs more money. Who would have guessed /s….
![How many people work for the US federal government? [OC]](https://www.europesays.com/wp-content/uploads/2025/02/73ql2m0qsjhe1-1920x1024.png)
35 comments
Source: [Bureau of Labor Statistics](https://data.bls.gov/dataViewer/view/timeseries/CES9091000001)
Tools: Datawrapper, Illustrator
More data [here](https://usafacts.org/articles/how-many-people-work-for-the-federal-government/)
Why are there huge spikes for some years?
I posted a similar chart a few weeks ago and several people wanted see how federal employment compares to the US population. I chatted with some folks here and landed on using a similar measure: federal employment compared to the size of the entire US workforce.
Federal government workers per capita shows that there are about as few as there ever have been in the post-WWII era.
https://preview.redd.it/cdp0284oujhe1.png?width=1320&format=png&auto=webp&s=210d63f773e6e5d06ead31c864151295366083b5
But Fox News told me the government is a massive wasteful juggernaut that keeps growing!
A few things I find interesting:
Reagan ran on smaller government, but it only increased during his time. Maybe military? Just looked it up and during the 80’s about 75% of federal workers were military related. It’s now around 50%. Makes sense with the cold war ending.
Besides census years, it looks like it’s remained pretty steady at around 2.75 million, with a recent jump to 3 million.
A funny thing happened in the early 40’s…
So, the federal governement is in-efficient because they have less man-power. Who would’ve thunk.
Does this include contractors? If not this is pointless.
needs to be lower. Lean and mean machine
I guess the Xgovernment will gladly do what your current govermant can’t. Democracy secured.
Government employees are only part of the picture. Full-time government contractors exceed the number of civil service employees.
US economy and free market is literally insane
in other countries this rate is like 10% usually, can go up to 25% in commie or regulated countries, and trump is cutting it even further
amazing sight to behold, be proud burgerians, this is unprecedented levels of success
Meanwhile, US Government spending as a fraction of GDP keeps going up. If it’s not direct headcount costs, then it’s indirect. That would make this direct employment chart is disengenuous — it’s like Walmart saying “we have 1,000 employees, but we have 100,000 contractors.”
Need a graph separating military and including contractors
Plot against the R and Ds perception of what percentage.
IMO – any reasonable organization needs 5-10% overhead costs – running the county is no different.
Its amazing how computers and automation have made people more efficient and in spite of that, if I want to provide documents to the IRS my options are to mail or fax a document.
Its not surprising the percentage has dropped, most government employees not in the postal service or military are white collar workers. We should see these jobs becoming more efficient, its just not efficient enough considering the technology available. Anyone who has delt with the IRS, Social Security Administration, Medicare/Medicaid, etc. knows exactly how inefficient, slow, bureaucratic, and backwards these agencies are compared to walking into literally any other business short of health insurance.
Disagree? Just try calling into the IRS or SSA and lmk how that goes.
This is a pointless comparison. Government’s function has nothing to do with business.
Holy hell 3 million people in the federal government alone?!?! I thought it was less than 2.. which is still crazy
Doesn’t look so “bloated” after all, does it?
*Christian Bale American psycho meme*
Very nice. Now include contractors and non-profits using federal grant money.
A reporter asked the Hoover Dam Project Leader how many men he had working on site. He answered, “About a third of ’em.”
Meaningless. Over 10% of the Federal budget is spent on contractors, while employee salaries comprise around 7%. The actually important figure is *spending*, as a percentage of the entire U.S. economy, and relative to tax receipts.
Here is spending relative to GDP:
https://fred.stlouisfed.org/series/FYONGDA188S.
Here is tax receipts as a percentage of GDP:
https://fred.stlouisfed.org/series/FYFRGDA188S
So, what you’ll find is that in spite of “massive” tax cuts, the overall percentage of American GDP taken in taxes has remained reasonably steady at around 16% for the past 80 years. Meanwhile, government outlays as a percentage of GDP have climbed steadily higher, going from around 17% in the 1960’s to 23% today.
So the money we spend keeps going up, and the money we take in taxes remains stubbornly flat.
Where is all the money going then? Inflation adjusted expenditures looks very different.
[https://www.federalbudgetinpictures.com/total-government-spending-quadruples/](https://www.federalbudgetinpictures.com/total-government-spending-quadruples/)
I’m curious how this compares to other comparable segments.
Cool we can lower that number to .4 million and I know where the rest can find new gainful employment
https://www.epi.org/blog/how-many-farmworkers-are-employed-in-the-united-states/
Cool, I wonder what state gov numbers would look like.
Is there a chart that shows the monthly share of the total population employed by the federal government?
So, Republicans have been getting what they wanted for the past 50 years and STILL they play the victim.
Hmm, but why start at 1939 when the gov already exploded in size due to the „new deal“ etc?
Would be nice to see the 19th century too.
Hmm, but why start at 1939 when the gov already exploded in size due to the „new deal“ etc? Would be nice to see the time before that too.
The thing that conservatives don’t understand (and/or don’t want you to understand) is that most government workers actually do something necessary. The last time the U.S. seriously slashed government workers, under Clinton in the 90s, all that happened was that contractors were brought in to do the work instead, and contractors cost more. Also as these charts show, we haven’t had any real growth in government workers in decades.
If you want to really go after waste, you need to do things like hit the Department of Defense and allow things like Medicare negotiating drug prices. Elon Musk’s “savings” are just intended to throw more money at billionaires and corporations. A few genuine “savings” might be found by slashing enforcement of things like clean air and clean water laws, but we’ll all pay for that in different ways.
Ironically, the best way to save the government money would probably be to reduce the use of contractors and hire *more* government employees, and the best way to improve the top line of the federal budget would be to hire more auditors for the IRS and have them go after the rich.
Of course Elon Musk is never going to do that, because his goal isn’t to improve the federal budget.
We have 3.1 million federal workers now as we did 40 years ago, 30% of them are veterans. That’s about 1 million vets.
Like $15 billion in contracts to Musk.
What’s funny is smaller government is more expensive, and excessively so. 2011 report of contractors (how government can make itself “smaller”) shows that government contractors cost 1.8-2x the cost of a federal employee. So privatization costs more money. Who would have guessed /s….
Report:
https://docs.pogo.org/report/2011/bad-business-report-only-2011.pdf
Comments are closed.