In 2017, I watched a Vox video [https://www.youtube.com/watch?v=imcDUnEs–Y] arguing that some US federal agency headquarters should be moved from Washington DC to the Midwest to stimulate local economies. One graphic showed three suggestions of agencies to move and the number of employees for each agency, with one of those agencies being the National Weather Service (NWS), a division of the National Oceanic and Atmospheric Administration (NOAA). The graphic had the correct number of employees for the agency at the time, and the video was correct that the NWS headquarters is in the Washington DC area (Silver Spring, MD), but the combination implied that all those employees work at headquarters / in the DC area, which is not true. I think this reflects a common misconception that federal employees mostly live and work in the Washington DC area, in cities, or in areas that lean heavily Democratic. Recent statements by the “Department of Government Efficiency” about ideas to move some agencies away from DC, and the Project 2025 Mandate for Leadership’s proposal to have the National Weather Service “fully commercialize its forecasting operations,” reminded me of the old Vox video and inspired me to make this graphic.
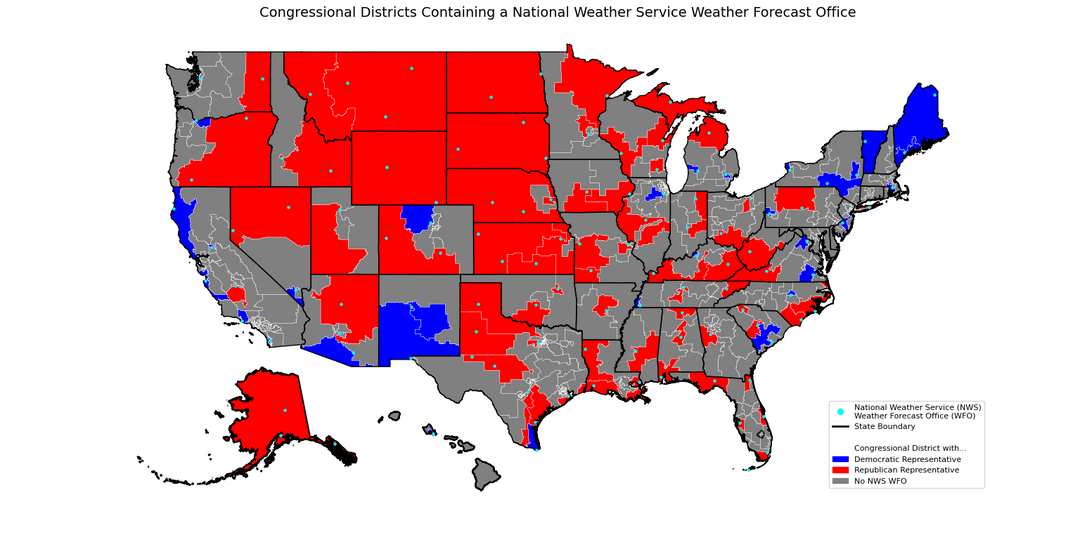
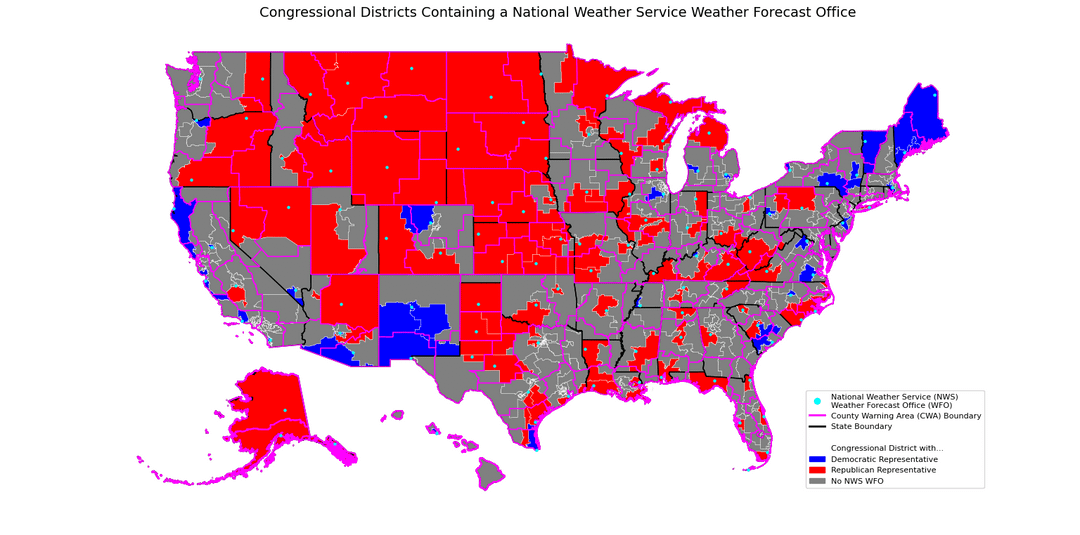
The first page shows the location of NWS Weather Forecast Offices, which congressional districts contain them, and which party represents those districts in the US House of Representatives. There are 103 US House Representatives with a NWS Weather Forecast Office in their district, 70 Republicans and 33 Democrats. Some districts in cities are small and may be hard to see. Some large districts (for example, Alaska) contain more than one office. Not shown are Weather Forecast Offices in Puerto Rico and Guam, or any of the National Weather Service’s other facilities, for example River Forecast Centers (usually co-located with Weather Forecast Offices) or the National Hurricane Center. The second slide shows the same map with the National Weather Service’s County Warning Area Boundaries overlaid; these are effectively the limits for where each office is responsible for issuing predictions. Using these boundaries, you can determine where your own local office is located.
The one in Seattle isn’t colored.
Edit: not sure if you got Long Island either.
Remind me when hurricane season begins
Is there a reason this seemingly useless data is somehow relevant to anything?
4 comments
Data sources:
States and congressional boundaries, [https://www.census.gov/geographies/mapping-files/time-series/geo/cartographic-boundary.html](https://www.census.gov/geographies/mapping-files/time-series/geo/cartographic-boundary.html)
NWS County Warning Area Boundaries, [https://www.weather.gov/gis/CWABounds](https://www.weather.gov/gis/CWABounds)
NWS Weather Forecast Offices, [https://en.wikipedia.org/wiki/List_of_National_Weather_Service_Weather_forecast_offices](https://en.wikipedia.org/wiki/List_of_National_Weather_Service_Weather_forecast_offices)
Parties representing each district, [https://en.wikipedia.org/wiki/List_of_current_United_States_representatives](https://en.wikipedia.org/wiki/List_of_current_United_States_representatives)
Tools: Python, MatPlotLib, Pandas/Geopandas, Shapely
In 2017, I watched a Vox video [https://www.youtube.com/watch?v=imcDUnEs–Y] arguing that some US federal agency headquarters should be moved from Washington DC to the Midwest to stimulate local economies. One graphic showed three suggestions of agencies to move and the number of employees for each agency, with one of those agencies being the National Weather Service (NWS), a division of the National Oceanic and Atmospheric Administration (NOAA). The graphic had the correct number of employees for the agency at the time, and the video was correct that the NWS headquarters is in the Washington DC area (Silver Spring, MD), but the combination implied that all those employees work at headquarters / in the DC area, which is not true. I think this reflects a common misconception that federal employees mostly live and work in the Washington DC area, in cities, or in areas that lean heavily Democratic. Recent statements by the “Department of Government Efficiency” about ideas to move some agencies away from DC, and the Project 2025 Mandate for Leadership’s proposal to have the National Weather Service “fully commercialize its forecasting operations,” reminded me of the old Vox video and inspired me to make this graphic.
The first page shows the location of NWS Weather Forecast Offices, which congressional districts contain them, and which party represents those districts in the US House of Representatives. There are 103 US House Representatives with a NWS Weather Forecast Office in their district, 70 Republicans and 33 Democrats. Some districts in cities are small and may be hard to see. Some large districts (for example, Alaska) contain more than one office. Not shown are Weather Forecast Offices in Puerto Rico and Guam, or any of the National Weather Service’s other facilities, for example River Forecast Centers (usually co-located with Weather Forecast Offices) or the National Hurricane Center. The second slide shows the same map with the National Weather Service’s County Warning Area Boundaries overlaid; these are effectively the limits for where each office is responsible for issuing predictions. Using these boundaries, you can determine where your own local office is located.
The one in Seattle isn’t colored.
Edit: not sure if you got Long Island either.
Remind me when hurricane season begins
Is there a reason this seemingly useless data is somehow relevant to anything?
Comments are closed.