
Feb 9, 2025
United Kingdom Bath Preparations Exports
In 2024, shipments abroad of perfumed bath salts and other bath preparations decreased by -20.8% to 6.6K tons, falling for the seventh consecutive year after two years of growth. Overall, exports recorded a abrupt downturn. The pace of growth was the most pronounced in 2016 when exports increased by 5.9% against the previous year. Over the period under review, the exports reached the peak figure at 21K tons in 2017; however, from 2018 to 2024, the exports remained at a lower figure.
In value terms, bath preparations exports declined significantly to $37M (IndexBox estimates) in 2024. Over the period under review, exports saw a deep slump. The pace of growth was the most pronounced in 2017 when exports increased by 3.5% against the previous year. The exports peaked at $86M in 2014; however, from 2015 to 2024, the exports stood at a somewhat lower figure.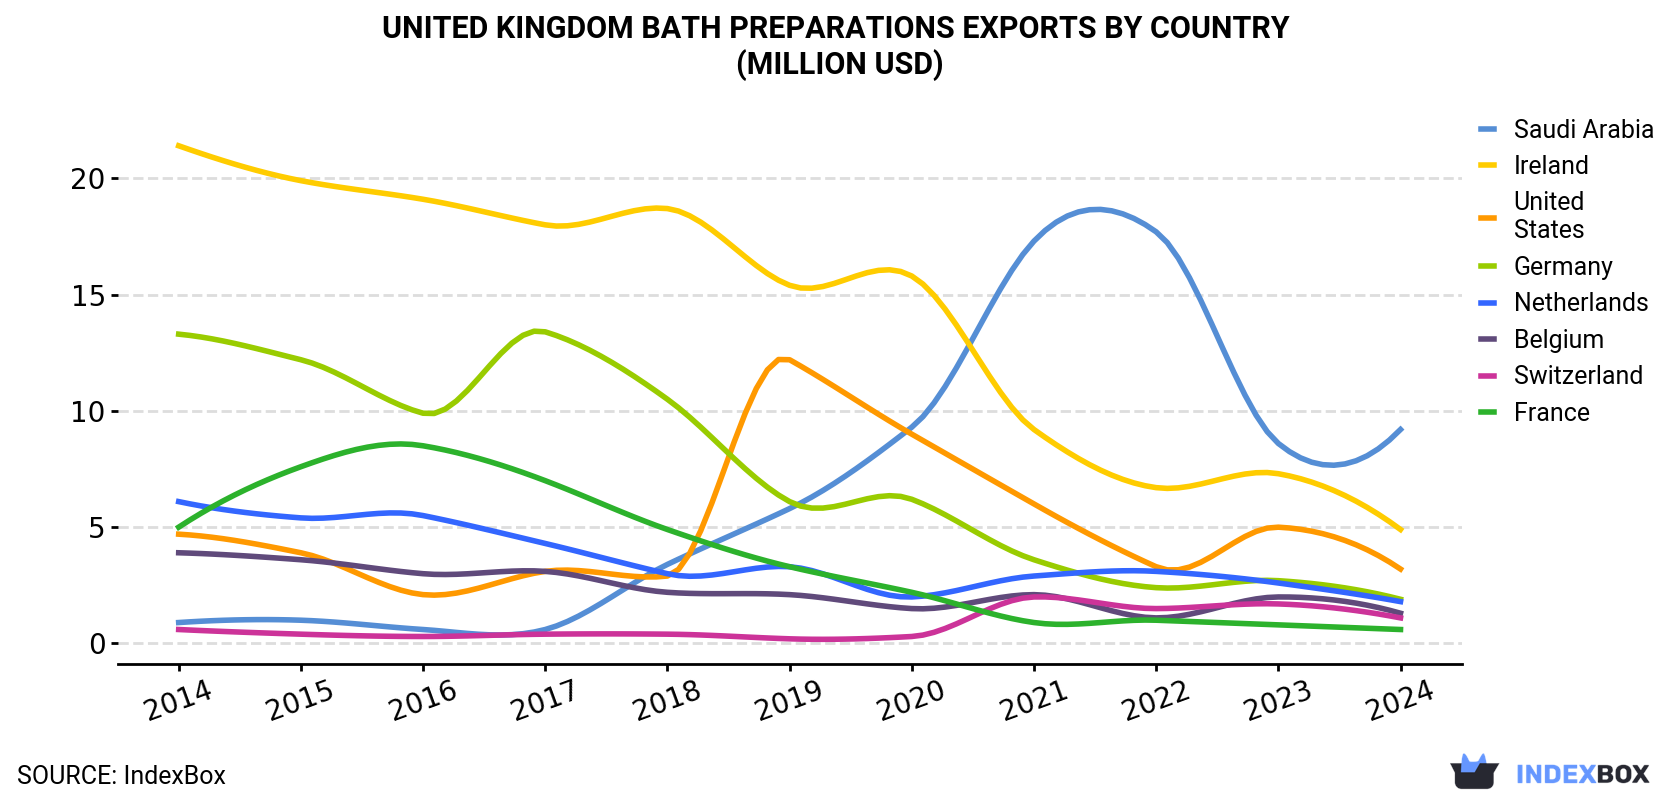
Exports by Country
Ireland (1.9K tons), Saudi Arabia (1.1K tons) and the Netherlands (466 tons) were the main destinations of bath preparations exports from the UK, with a combined 52% share of total exports.
From 2014 to 2024, the biggest increases were recorded for Saudi Arabia (with a CAGR of +29.3%), while shipments for the other leaders experienced mixed trend patterns.
In value terms, the largest markets for bath preparations exported from the UK were Saudi Arabia ($9.2M), Ireland ($4.9M) and the United States ($3.2M), together comprising 47% of total exports.
Among the main countries of destination, Saudi Arabia, with a CAGR of +26.6%, recorded the highest rates of growth with regard to the value of exports, over the period under review, while shipments for the other leaders experienced mixed trend patterns.
Export Prices by Country
In 2024, the bath preparations price stood at $5,583 per ton (FOB, United Kingdom), remaining stable against the previous year. Over the period from 2014 to 2024, it increased at an average annual rate of +2.2%. The pace of growth was the most pronounced in 2018 when the average export price increased by 22%. The export price peaked at $5,693 per ton in 2021; however, from 2022 to 2024, the export prices stood at a somewhat lower figure.
Prices varied noticeably by country of destination: amid the top suppliers, the country with the highest price was the United States ($10,079 per ton), while the average price for exports to Ireland ($2,582 per ton) was amongst the lowest.
From 2014 to 2024, the most notable rate of growth in terms of prices was recorded for supplies to the Czech Republic (+11.3%), while the prices for the other major destinations experienced more modest paces of growth.
This report provides an in-depth analysis of the bath preparations market in the UK. Within it, you will discover the latest data on market trends and opportunities by country, consumption, production and price developments, as well as the global trade (imports and exports). The forecast exhibits the market prospects through 2030.
Product coverage:Prodcom 20421975 – Perfumed bath salts and other bath preparations Country coverage:Data coverage:Market volume and valuePer Capita consumptionForecast of the market dynamics in the medium termTrade (exports and imports) in the UKExport and import pricesMarket trends, drivers and restraintsKey market players and their profilesReasons to buy this report:Take advantage of the latest dataFind deeper insights into current market developmentsDiscover vital success factors affecting the market
This report is designed for manufacturers, distributors, importers, and wholesalers, as well as for investors, consultants and advisors.
In this report, you can find information that helps you to make informed decisions on the following issues:
How to diversify your business and benefit from new market opportunitiesHow to load your idle production capacityHow to boost your sales on overseas marketsHow to increase your profit marginsHow to make your supply chain more sustainableHow to reduce your production and supply chain costsHow to outsource production to other countriesHow to prepare your business for global expansion
While doing this research, we combine the accumulated expertise of our analysts and the capabilities of artificial intelligence. The AI-based platform, developed by our data scientists, constitutes the key working tool for business analysts, empowering them to discover deep insights and ideas from the marketing data.
1. INTRODUCTION
Making Data-Driven Decisions to Grow Your Business
REPORT DESCRIPTION
RESEARCH METHODOLOGY AND AI PLATFORM
DATA-DRIVEN DECISIONS FOR YOUR BUSINESS
GLOSSARY AND SPECIFIC TERMS
2. EXECUTIVE SUMMARY
A Quick Overview of Market Performance
KEY FINDINGS
MARKET TRENDS
This Chapter is Available Only for the Professional Edition
PRO
3. MARKET OVERVIEW
Understanding the Current State of The Market and Its Prospects
MARKET SIZE
MARKET STRUCTURE
TRADE BALANCE
PER CAPITA CONSUMPTION
MARKET FORECAST TO 2030
4. MOST PROMISING PRODUCT
Finding New Products to Diversify Your Business
This Chapter is Available Only for the Professional Edition
PRO
TOP PRODUCTS TO DIVERSIFY YOUR BUSINESS
BEST-SELLING PRODUCTS
MOST CONSUMED PRODUCT
MOST TRADED PRODUCT
MOST PROFITABLE PRODUCT FOR EXPORT
5. MOST PROMISING SUPPLYING COUNTRIES
Choosing the Best Countries to Establish Your Sustainable Supply Chain
This Chapter is Available Only for the Professional Edition
PRO
TOP COUNTRIES TO SOURCE YOUR PRODUCT
TOP PRODUCING COUNTRIES
TOP EXPORTING COUNTRIES
LOW-COST EXPORTING COUNTRIES
6. MOST PROMISING OVERSEAS MARKETS
Choosing the Best Countries to Boost Your Exports
This Chapter is Available Only for the Professional Edition
PRO
TOP OVERSEAS MARKETS FOR EXPORTING YOUR PRODUCT
TOP CONSUMING MARKETS
UNSATURATED MARKETS
TOP IMPORTING MARKETS
MOST PROFITABLE MARKETS
7. PRODUCTION
The Latest Trends and Insights into The Industry
PRODUCTION VOLUME AND VALUE
8. IMPORTS
The Largest Import Supplying Countries
IMPORTS FROM 2012–2024
IMPORTS BY COUNTRY
IMPORT PRICES BY COUNTRY
9. EXPORTS
The Largest Destinations for Exports
EXPORTS FROM 2012–2024
EXPORTS BY COUNTRY
EXPORT PRICES BY COUNTRY
10. PROFILES OF MAJOR PRODUCERS
The Largest Producers on The Market and Their Profiles
This Chapter is Available Only for the Professional Edition
PRO
LIST OF TABLES
Key Findings In 2024
Market Volume, In Physical Terms, 2012–2024
Market Value, 2012–2024
Per Capita Consumption In 2012-2024
Imports, In Physical Terms, By Country, 2012–2024
Imports, In Value Terms, By Country, 2012–2024
Import Prices, By Country Of Origin, 2012–2024
Exports, In Physical Terms, By Country, 2012–2024
Exports, In Value Terms, By Country, 2012–2024
Export Prices, By Country Of Destination, 2012–2024
LIST OF FIGURES
Market Volume, In Physical Terms, 2012–2024
Market Value, 2012–2024
Market Structure – Domestic Supply vs. Imports, In Physical Terms, 2012-2024
Market Structure – Domestic Supply vs. Imports, In Value Terms, 2012-2024
Trade Balance, In Physical Terms, 2012-2024
Trade Balance, In Value Terms, 2012-2024
Per Capita Consumption, 2012-2024
Market Volume Forecast to 2030
Market Value Forecast to 2030
Products: Market Size And Growth, By Type
Products: Average Per Capita Consumption, By Type
Products: Exports And Growth, By Type
Products: Export Prices And Growth, By Type
Production Volume And Growth
Exports And Growth
Export Prices And Growth
Market Size And Growth
Per Capita Consumption
Imports And Growth
Import Prices
Production, In Physical Terms, 2012–2024
Production, In Value Terms, 2012–2024
Imports, In Physical Terms, 2012–2024
Imports, In Value Terms, 2012–2024
Imports, In Physical Terms, By Country, 2024
Imports, In Physical Terms, By Country, 2012–2024
Imports, In Value Terms, By Country, 2012–2024
Import Prices, By Country Of Origin, 2012–2024
Exports, In Physical Terms, 2012–2024
Exports, In Value Terms, 2012–2024
Exports, In Physical Terms, By Country, 2024
Exports, In Physical Terms, By Country, 2012–2024
Exports, In Value Terms, By Country, 2012–2024
Export Prices, By Country Of Destination, 2012–2024