One of the supposed divides amongst traders is that between those who rely on technical analysis, the study of charts and price action, and those for whom fundamentals, the basics of supply and demand in the case of a commodity such as oil, are more important. In reality, traders, or at least those that are successful, use both. Most start with a base case formed by studying fundamentals, then use chart analysis to establish entry and exit points. The exceptions would be those who trade with very short time horizons, where chart reading is far more important than fundamental analysis. If you are looking at the next few minutes, chart levels that prompt responses by human and algorithmic traders are far more influential than fluctuations in fundamental

That said, though, there are times when a position taken with a longer time horizon and based on fundamental analysis has to be cut or adjusted because of what the chart tells you. That is why I am taking a profit on a longer-term short crude position, and am considering reversing it to a long.

Three weeks ago, I wrote in these pages that even though crude was popping on the back of US inflation data that the market saw as a positive for the economy, or more accurately for interest rates in the US, I remained convinced that the logical path for oil prices in the coming weeks was downwards. There was a counterargument to that, of course…there always is. In this case it was that US inventories were low, creating tight…

One of the supposed divides amongst traders is that between those who rely on technical analysis, the study of charts and price action, and those for whom fundamentals, the basics of supply and demand in the case of a commodity such as oil, are more important. In reality, traders, or at least those that are successful, use both. Most start with a base case formed by studying fundamentals, then use chart analysis to establish entry and exit points. The exceptions would be those who trade with very short time horizons, where chart reading is far more important than fundamental analysis. If you are looking at the next few minutes, chart levels that prompt responses by human and algorithmic traders are far more influential than fluctuations in fundamental

That said, though, there are times when a position taken with a longer time horizon and based on fundamental analysis has to be cut or adjusted because of what the chart tells you. That is why I am taking a profit on a longer-term short crude position, and am considering reversing it to a long.

Three weeks ago, I wrote in these pages that even though crude was popping on the back of US inflation data that the market saw as a positive for the economy, or more accurately for interest rates in the US, I remained convinced that the logical path for oil prices in the coming weeks was downwards. There was a counterargument to that, of course…there always is. In this case it was that US inventories were low, creating tight supply, and that the Trump administration’s pro-fossil fuel policies would be stimulative for oil demand, both here in the US and elsewhere when America stopped trying to lead the world to lower emissions.

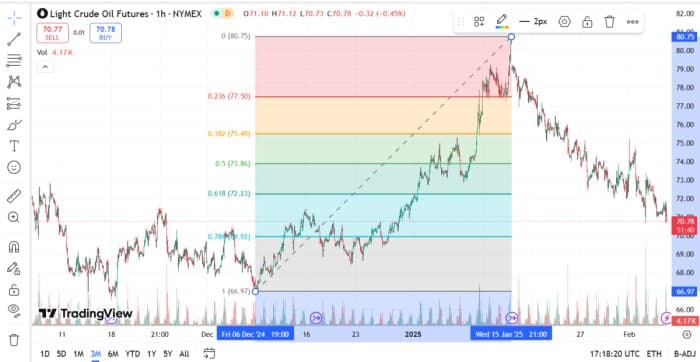
Those, however, were some of the reasons for the jump up to over $80, and that move, I maintained, was not sustainable given the long term fundamental outlook. I guess I was right, based on the chart below.

Oil

As you can see, since that brief sojourn above $80, crude futures (CL) have dropped dramatically. However, the annotations on the chart, which are basic Fibonacci retracement levels, suggest that a bounce back is coming soon.

If you look closely, you can see that a week or so ago there was a bit of a bounce back. After testing the downside at around $72 twice, CL reversed for a while, hitting a point above $75 before heading lower again. Interestingly, that pivot point was right around the $72.23 level that represented a 61.8% retracement of the strong move up in December and January. The next significant level from a Fib point of view is the 78.6% retracement level, just above $70. Add in the psychological importance of $70, and another retracement is definitely on the cards.

Those of you who are accustomed to my trading style know that I often combine Elliott wave theory with Fibonacci levels and that analysis would indicate that if a reversal comes comes, it will fall short of $75 and be followed by a fifth wave in a downward direction that would push crude below $70, with the starting point of the move up, at around $67, as the next support. If fundamental conditions generally were still the same as they were a month ago, that is what I would expect, but they are not.

It has become clear that the tariffs Trump threatened, at least on Canada and Mexico, are more of a negotiating tactic than an actual strategy. They were “imposed” over last weekend, then quickly “paused”. There is a good chance that they, and the inflation that they would have likely caused, are not coming any time soon, but even the hint of restricted oil supply from Canada will put upward pressure on prices in some areas of America. Meanwhile, the US economy remains strong, and if the Bank of England’s resumption of rate cuts this week is anything to go by, there is a good chance of improved growth in other parts of the world as well.

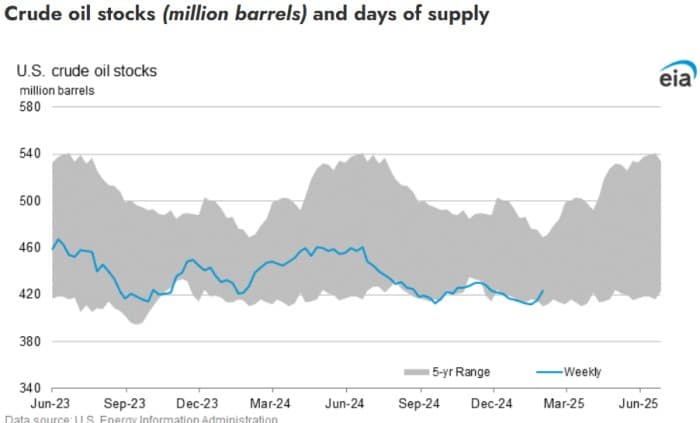
In that situation, the low crude oil inventory levels in the US shown in the chart below become a real factor…

Crude

We are at the bottom of the 5-year average range, so any increase in demand, even a small one, will push prices higher.

My change of heart here started as a purely technical one, based on a simple Fibonacci analysis, but when I considered what to do next, a reevaluation of supply and demand conditions enabled me to see that when a reversal does come, it could easily gain momentum quite quickly. I don’t want to be on the wrong side of that move when it comes, so I will be not just cutting my short, but actually reversing to a long position at current levels.