Tools: Spyder (plotly, matplotlib) and Photo Affinity
Story:
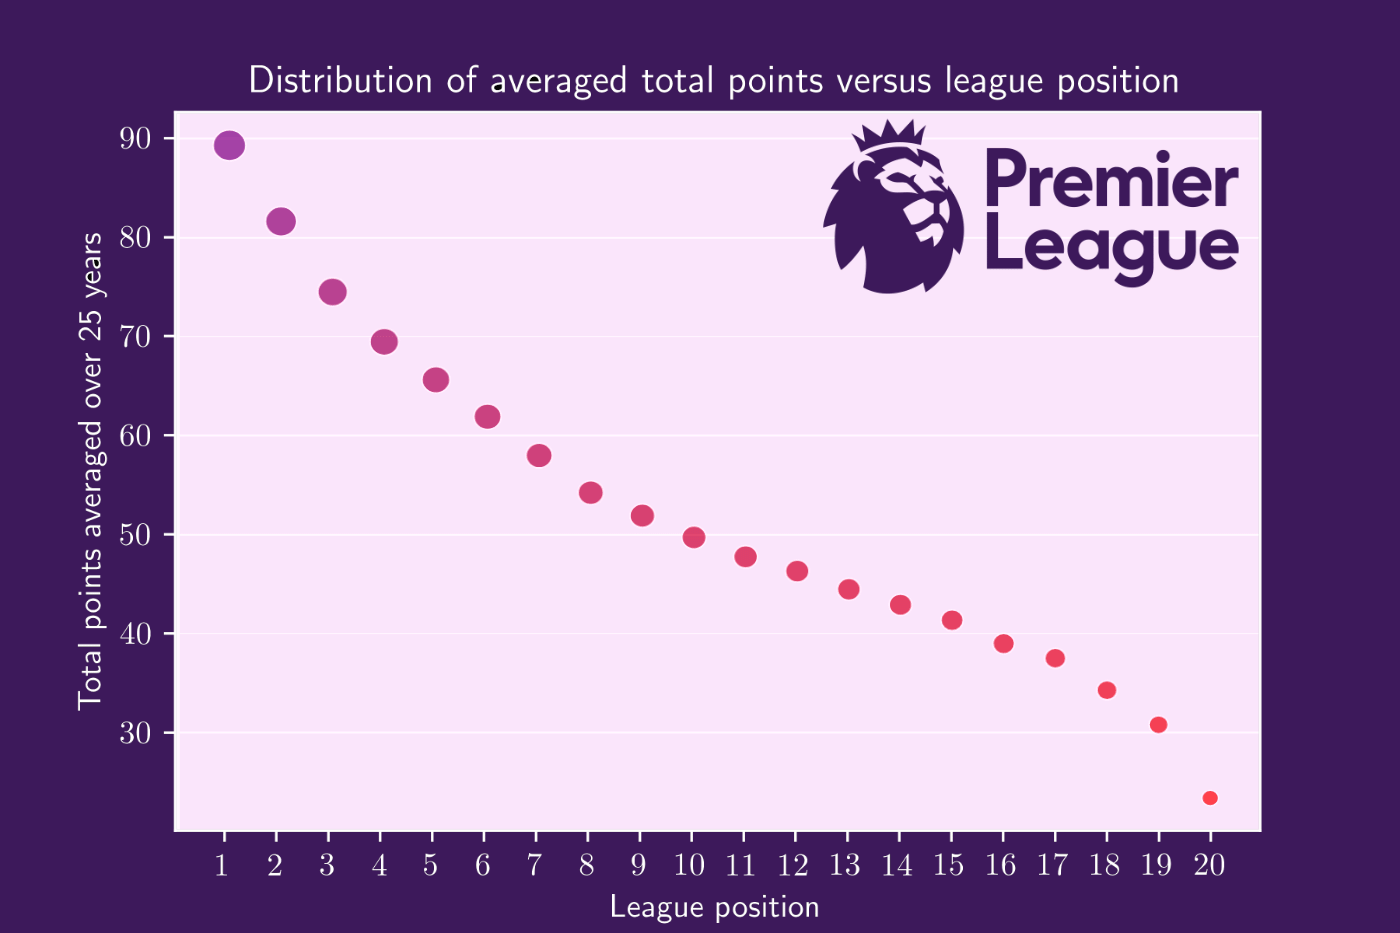
I was curious if it was possible to calculate the ‘magic number’ (necessary points to escape relegation) and the distribution of any football league table (what kind of distribution it is?). It turns out that, yes, with some mathematical assumptions, the distribution can be calculated. It was a form of inverse complementary error function (inverse erfc), so I checked if EPL obeyed this principle, yes, it converges nicely when averaged across 25 years. The expression for the ‘magic number’ can also be calculated, but it’s very tedious and no closed form.
So basically every year there is one team that really sucks. That team is Manchester United. There is also a team in 20th position with way fewer points than anyone else, but that’s another story.
Pretty cool viz. Lines up nicely with the rules of thumb I always use: 90 points to win, 80 points for 2nd, 70 points for UCL, 60 points for Europe, 50 points for top half, and 40 points to escape relegation. Many exceptions (especially the first two) but it usually tends to be pretty close to that and the data here backs it up.
Variance would be interesting, guess it’s quite high given only 25 samples are contributing. Still, pretty cool that the means are so well aligned!
4 comments
Data source: [https://en.wikipedia.org/wiki/Premier_League](https://en.wikipedia.org/wiki/Premier_League)
Tools: Spyder (plotly, matplotlib) and Photo Affinity
Story:
I was curious if it was possible to calculate the ‘magic number’ (necessary points to escape relegation) and the distribution of any football league table (what kind of distribution it is?). It turns out that, yes, with some mathematical assumptions, the distribution can be calculated. It was a form of inverse complementary error function (inverse erfc), so I checked if EPL obeyed this principle, yes, it converges nicely when averaged across 25 years. The expression for the ‘magic number’ can also be calculated, but it’s very tedious and no closed form.
So basically every year there is one team that really sucks. That team is Manchester United. There is also a team in 20th position with way fewer points than anyone else, but that’s another story.
Pretty cool viz. Lines up nicely with the rules of thumb I always use: 90 points to win, 80 points for 2nd, 70 points for UCL, 60 points for Europe, 50 points for top half, and 40 points to escape relegation. Many exceptions (especially the first two) but it usually tends to be pretty close to that and the data here backs it up.
Variance would be interesting, guess it’s quite high given only 25 samples are contributing. Still, pretty cool that the means are so well aligned!
Comments are closed.