![[OC] Magnificent Eight - Megacap Tech with $1T+ Market Cap - Net Income History](https://www.europesays.com/wp-content/uploads/2025/02/30ty4hl2brie1-1920x1024.jpeg)
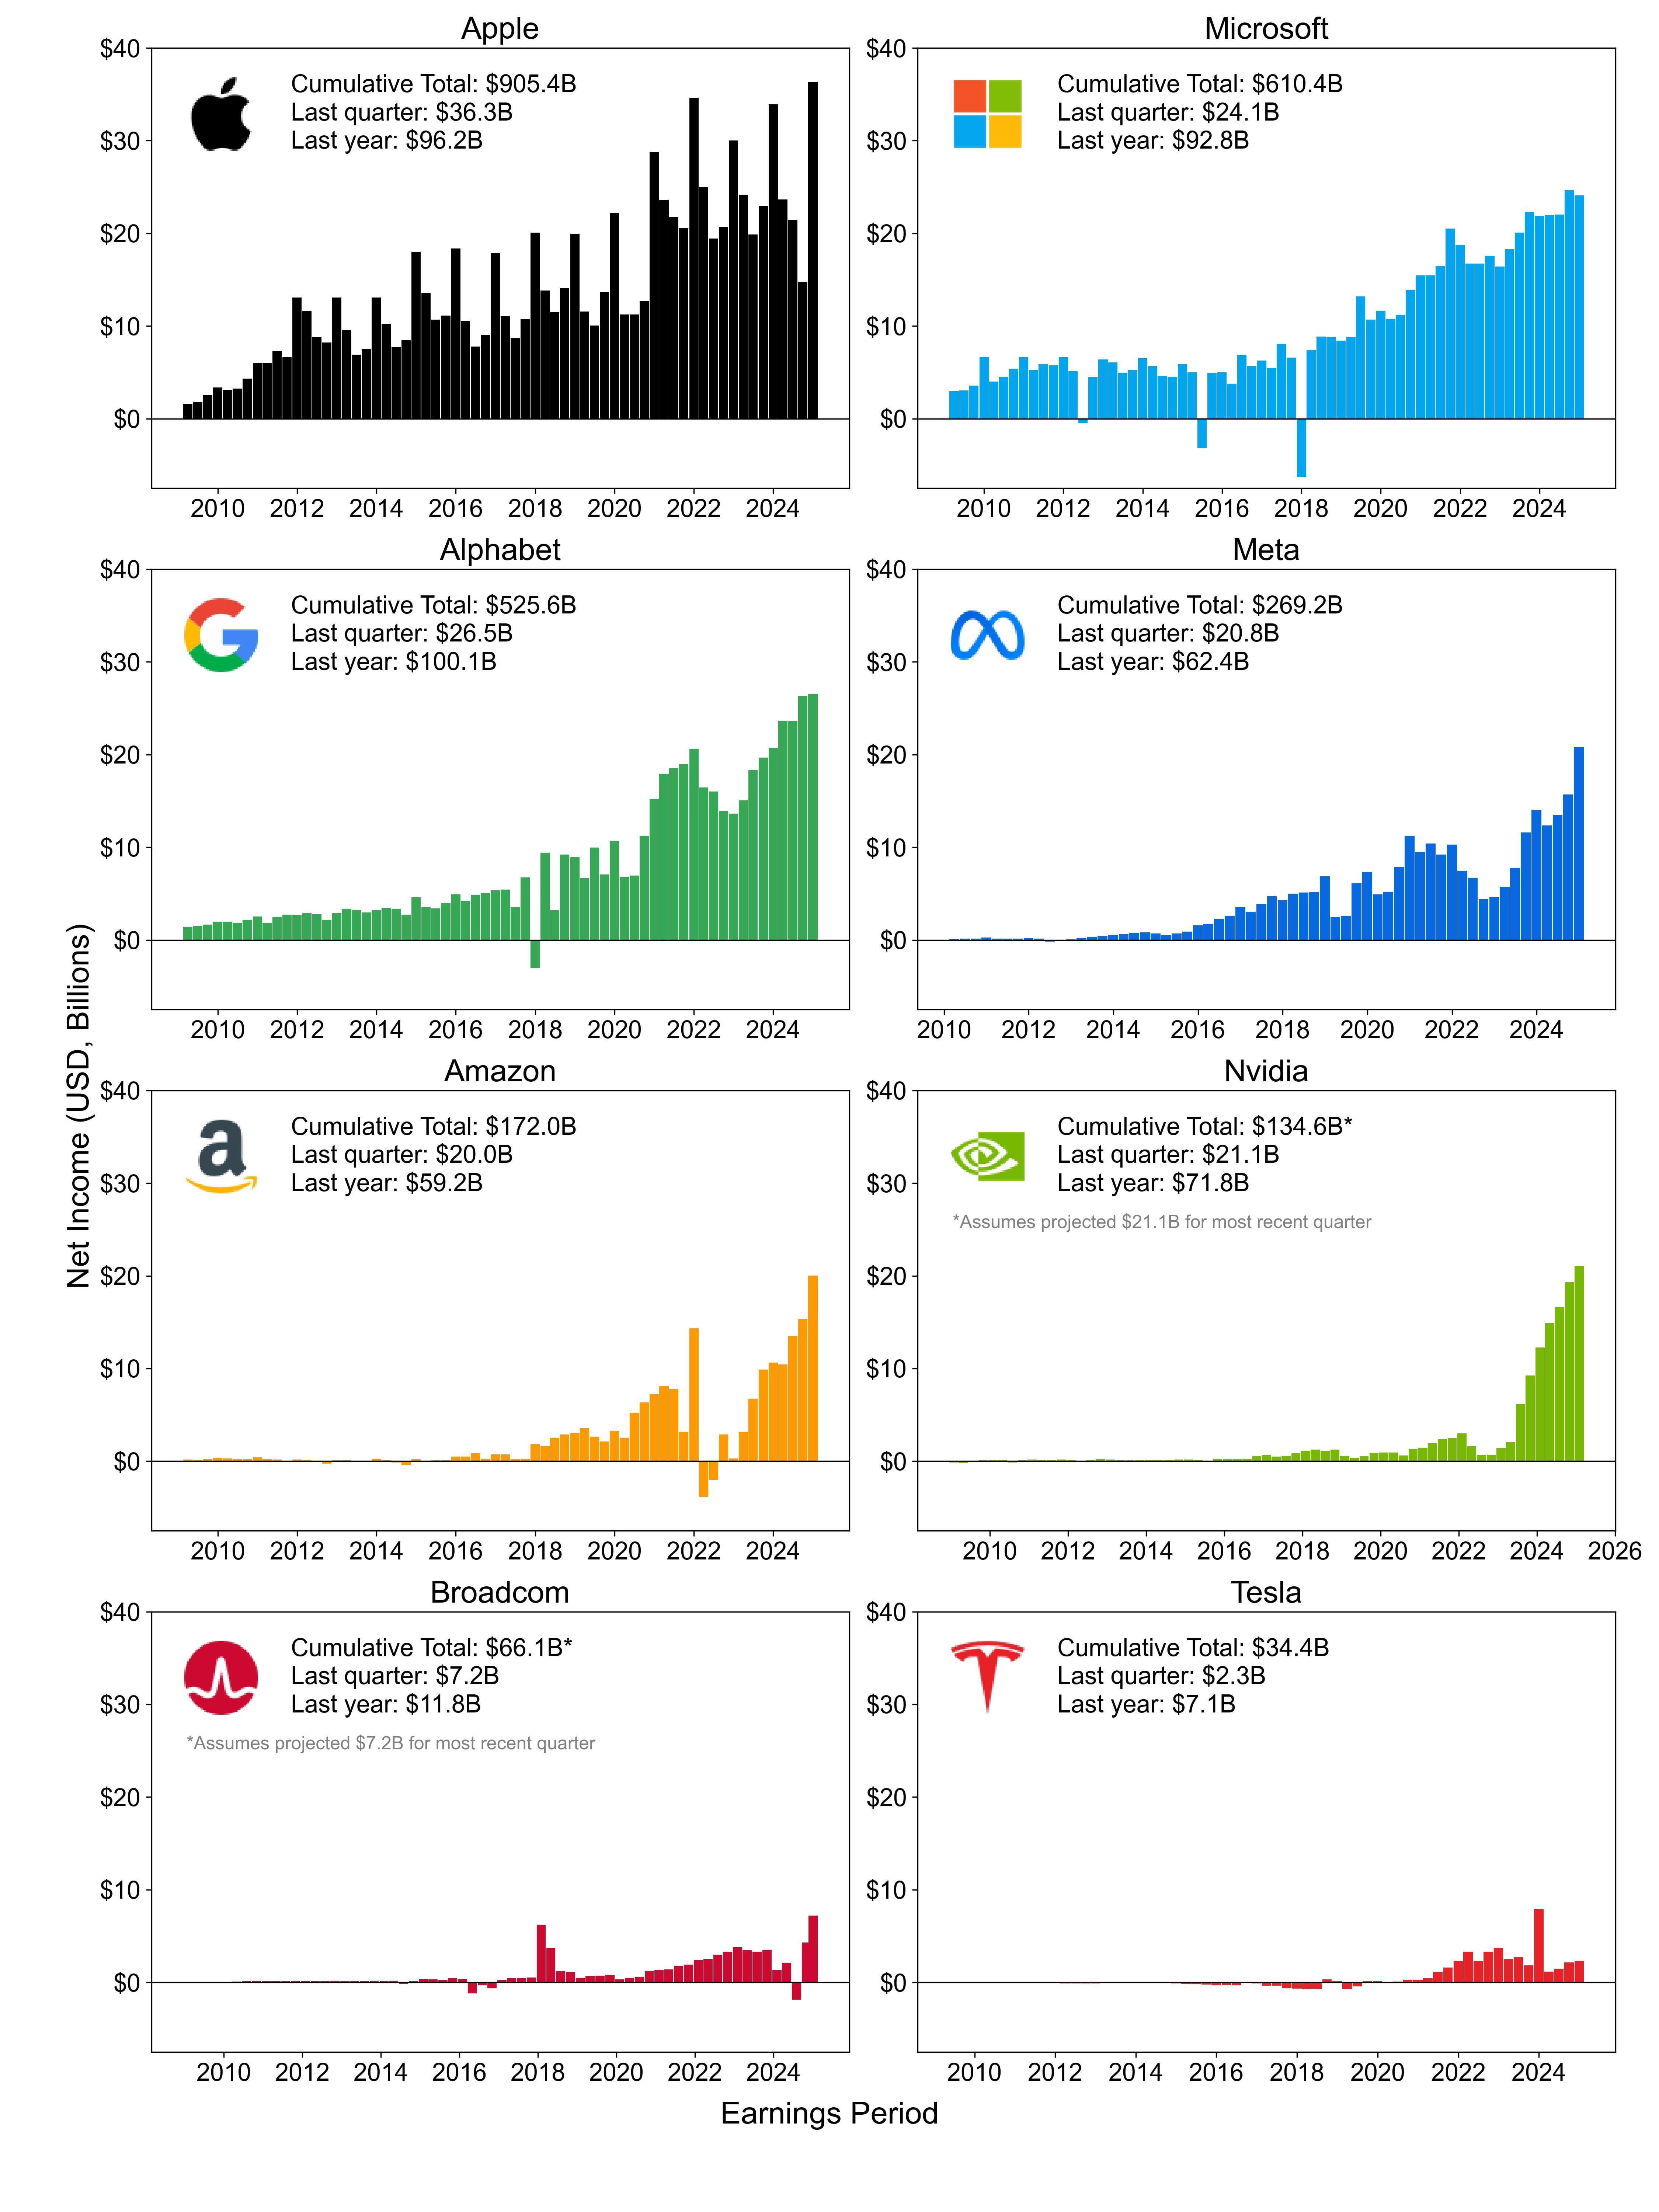
I thought it would be fun to plot the earnings (net income) history of the mega tech companies: the "Magnificent Seven" plus Broadcom, which I included for reasons discussed below. I gathered information from Macrotrends, which has earnings report dating back to early 2009. For most cases that was sufficient: only Microsoft, Apple, and Alphabet generated meaningful earnings before then, and it still made up a relatively small portion in nominal terms. (Sources: Apple, Microsoft, Alphabet, Meta, Amazon, Nvidia, Broadcom, Tesla)
A couple things to note:
- Broadcom is not considered part of the Magnificent Seven, but I needed an eighth company to add to the layout. Since they are a mega tech with a $1T market cap (higher than Tesla) with higher earnings, I thought they would be a logical inclusion
- Since Nvidia and Broadcom have yet to report for the quarter, I estimated net income based on consensus EPS. This likely underestimates since they reliably beat projections (especially Nvidia).
- I plotted all the companies on the same vertical scale so that we could directly compare differences in their earnings.
- At $34.4B (likely generous since it excludes much of the early period when Tesla was not profitable), Tesla has generated less cumulative net income than Apple, Microsoft, Alphabet, Meta, Amazon, and Nvidia did in the last two quarters alone. Moreover, it net less income in its entire corporate lifespan than Apple did in last quarter alone, in what was generally viewed as a disappointing quarter for Apple.
- The lead with which Apple has over the rest of the field is remarkable, although the overall trend appears flat. But I didn't appreciate the very strong seasonal trend with each release cycle leading into the holiday season.
- Alphabet actually takes the lead for the last year, topping $100 billion in net income.
- I was surprised to learn that despite a late start, Meta has actually made more money cumulatively than Amazon.
- Amazon was not profitable for much of its corporate existence (pre-2009 data not available although likely not significant). However, its recent growth story has been incredibly impressive.
- Speaking of growth, Nvidia has gone gangbusters since shifting its focus to datacenters.
- Broadcom's earnings history is not as impressive as the previous six, but much of this is due to increased expenses from its $69B acquisition of VMWare.
- The spike in Tesla's 2023Q4 earnings report was from a one-time $5.9B tax benefit.
- Data generated using Python matplotlib.
Posted by Prudent-Corgi3793
13 comments
I have no idea how Tesla is worth a trillion dollars. It is just the dumbest thing I can imagine.
Thank you for this beautiful data presentation! There is so much done “right” in this graph.
PS: what about the quarters with Microsoft losses?
2012 was writing off Aquantive, 2015 Nokia, and 2018…?
very cool to see.
Tesla truly is wildly overvalued.
Nvidia is on an absolute tear it’s remarkable.
Im no psychic, but i already know in this thread we’re going to get a whole lot of comments about a certain individual due to their political views and no actual comments on the theories of how stocks are valued (mostly based on anticipated future earnings and not past earnings).
Is Apple the greatest company ever, that chart is god damn impressive.
Tesla has no business being a trillion dollar company.
These graphs are amazing. Thank you.
What contributes to the regular spikes in Apples value?
Not sure if i believe apples numbers fully something seems fishy
Great to see thank you. Will definitely be keeping this in mind for my investments.
Also thanks for keeping the y axis consistent between charts
Do investors really think meta has good fundamentals? I see a decaying social media platform, one soon to decay, and a whole lot wasted on costly boondoggles
One of these things is not like the others…
Tesla is so wild, especially when you consider Elon thinks he deserves more in stock grants than profits the company has produced in its lifetime!
Comments are closed.