Could we get a simple points-per-dollar ratio instead?
After a certain point, theres always a diminishing return. Like a car , theres a way bigger difference between a 30K $ car and a 50k car than between a 70k and a 90k car.
It’s very much possible that rtings is affecting their scores based on the price. Psychology is a bitch.
I watch everything on my 24 inch 1080p gaming monitor tbh.
Also depends on what is making the tv expensive. Are you getting a giant lcd tv or a smaller OLED? I spent more more money than normal on my oled and I’d say it’s worth it over the tv’s I’ve had in the past.
Classc diminishing returns curve
Seems like $1200-$1500 is the sweet spot
It’s impossible for it not to diminish in score, as you can’t go over 10. That, plus ratings often implicitly take into account price.
That trend line doesn’t look right. I don’t think it fits the data
This is light on analytics and heavy on generating revenue via affiliate links. Not much value-add vs just using the rtings site. Keep working at it.
That trendiness is a horrible fit. There’s nothing upward after 1500/2000. It’s linear first than flat.
That is a poor fitting model, that trend has plateaud
Something like this, you want to highlight the pareto frontier. Very cool content.
Now this is the analysis I need – a graph when I go buying. I bought the most optimal tv, but my cash got locked in and de-appreciated. So, unless I am renting that tv and earning i dont want it
That trend line doesn’t seem to particularly fit the data.Like, the trend ends significantly above the highest datapoint. The data looks linear and then very rapidly flattens out. The curve you’ve chosen to model the regression by just doesn’t seem correct to my eyes.
1500 is the value sweet spot.
It would be interesting to include features and compare their effect on price and ratings. As in, feature X increases the price by Y, and the rating by Z. It would show which features offer the biggest bang for your buck.
The biggest jumps in quality come from jumps in technology. OLED is better than regular LED. Differences within tech are more related to name brand, sometimes reliability or overall design.
Now that 98″ to 100″ TVs are affordable I wish they would test and rate those sized directly, instead of just assuming all sized are similar to the 65″ performance.
I think there are a couple factors that would be more important to break out.
Size vs price
Display vs price
Brand vs price
The interface one a 200 tv vs 2000 tv may be almost exact, because it can be across all models, while something like oled vs led vs etc. may be a better indicator of price/satisfaction.
$1000 to $1500 is the sweet spot. Not surprising though, there are some in pretty beautiful tvs in that price range. You can get mid to low end OLED and high end TCL/Hisense mini led tvs are amazing.
It’s hard to quantify something like a TV down on the high end, as they often target niches with leading edge standards, or form factors that are more bougie.
Like if you are spending $10k on a TV, you aren’t buying a 65″. Doesn’t matter what RTings says, you’ll be hunting for like a 85″+ 8k TV, which isn’t captured on this chart at all.
Who is paying more than 600 for a 65” tv? Just got mine from Costco online 4k qled smart tv for 250
I’m not sure that fit line is very accurate. Interesting though
I’d say 1000-1500 is a sweet spot if you are willing to spend a bit more
Yeah, that curve looks about what I’d expect. It does seem to be a great fit though
TVs have had such a drop in prices in the past 10 years its insane. This might be the only technology that’s gotten more affordable over time. You can walk into best buy and get a decent tv for 250, but 10 years ago you had to be willing to drop at least 6-700.
things that are used to me just about everyday i. life, and what I really know well, and are passionate about — I like to stop at that one little peak in the curve I think of as the prosumer level.
I’m a designer by trade so seeing things is what I get paid for at my day job. I see the LG C4 OLED in that area (love those inky blacks) as the end of the sweet spot for my eyes and budget. The G4, to go further up, is where things start to drop off for me. I’m can’t tell too much a difference for the price justification. Theres the high-end Sony MiniLEDs I’ve yet to see, but are very intrigued. But if I went miniLED its much easier to settle for a Samsung QN90D in the “is 1,000” more getting me that much. No in my case; but I do know visual folks with bigger wallets that I that can and will go for it.
Thats a great graph. [RTINGS is a wonderful reviewer](https://www.rtings.com/) and recommend a sub to them any chance I can.
It seems like you are best to spend somewhere between 1300 to 1500 dollars for your TV. That is like the sweet spot for value and a reputable TV. But that being said, sometimes it makes sense to buy last year’s model that was 2000+ dollars and now is in that 1300 to 1500 dollars range because it’s a year older. There aren’t enough upgrades each year to justify getting cutting edge OLED or micro led TVs. Last year’s model will be really good for most of us.
I feel like if you presented that curve as the best fit for that data in a college level course you would get a D at best.
You could create an indifference curve based on how much you value the rating vs the price of the TV and find the optimal price point for spending by finding where the curve is tangent to the regression in this data.
Paid $1600 for my LG C2… runs circles around the Sony I had both with Dolby vision and HDR
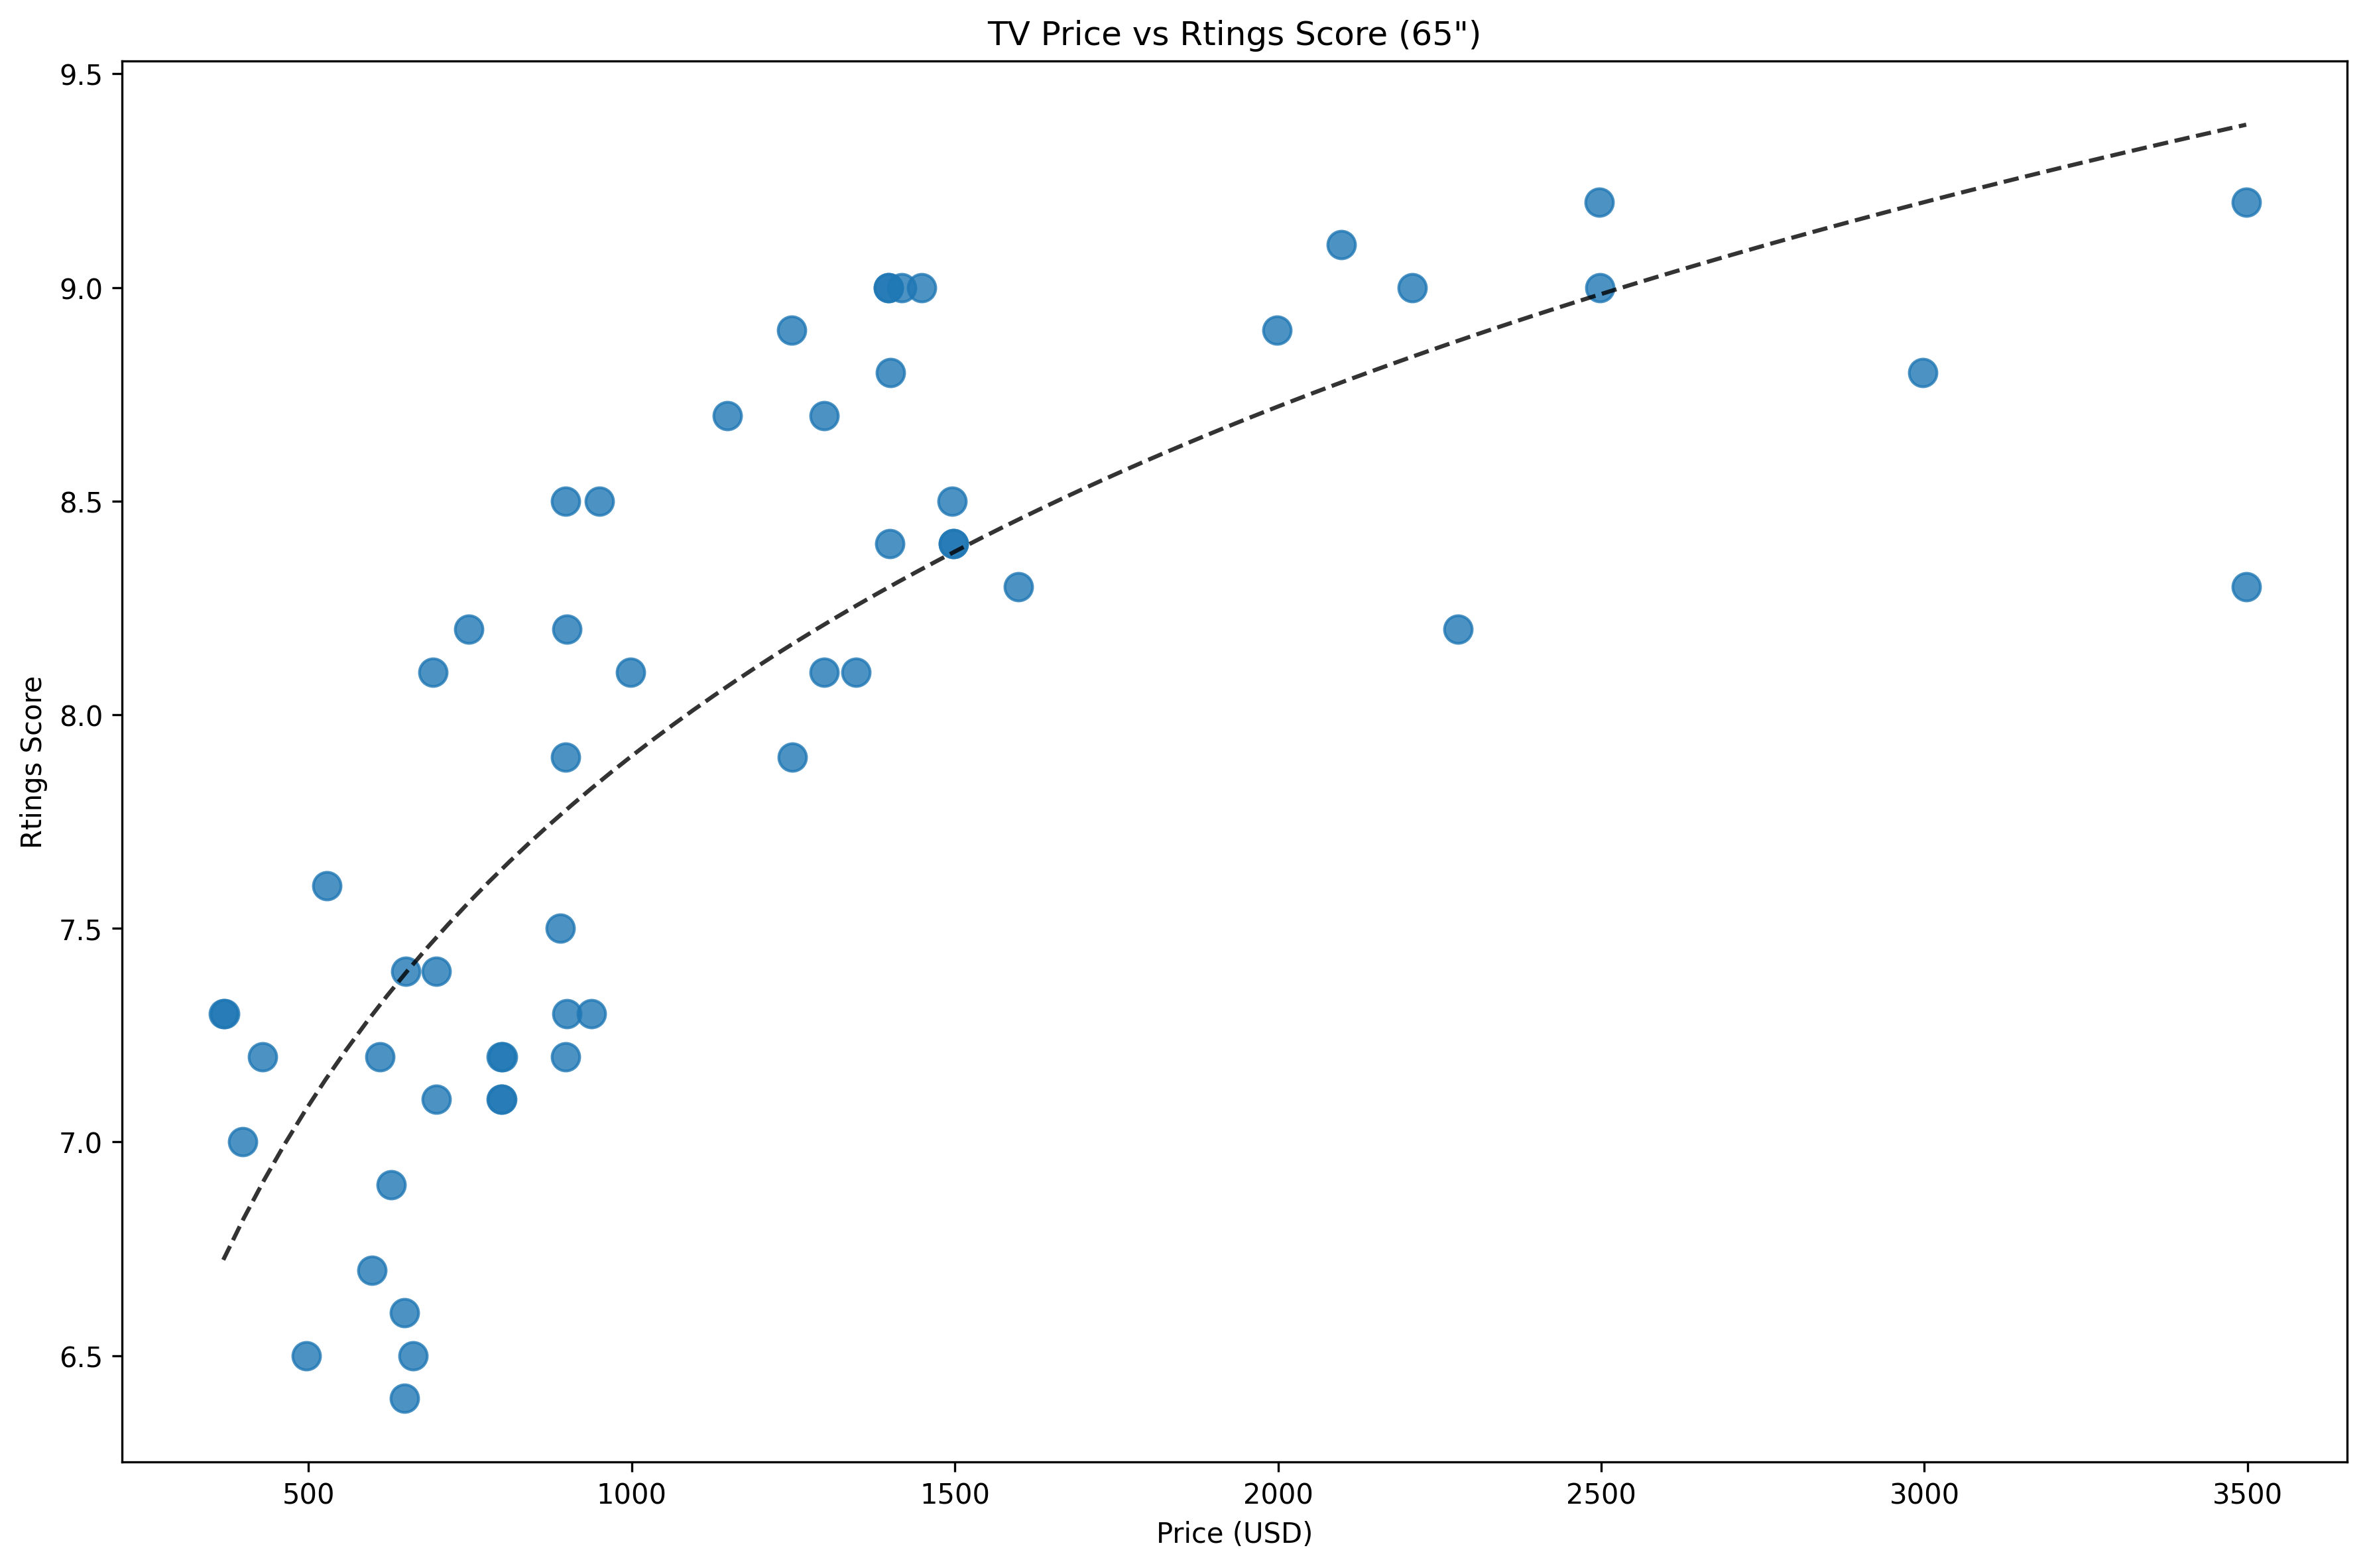
![[OC] Are expensive TVs worth it? Analyzing TV prices and Rtings.com scores](https://www.europesays.com/wp-content/uploads/2025/02/a9gek449ucje1-1920x1024.png)
34 comments
I think that something like an error function would fit this data much better
Prices from Amazon, scores from rtings.com.
Made using Python and matplotlib.
Full article: https://comparetvprices.com/are-expensive-tvs-worth-it/
Could we get a simple points-per-dollar ratio instead?
After a certain point, theres always a diminishing return. Like a car , theres a way bigger difference between a 30K $ car and a 50k car than between a 70k and a 90k car.
It’s very much possible that rtings is affecting their scores based on the price. Psychology is a bitch.
I watch everything on my 24 inch 1080p gaming monitor tbh.
Also depends on what is making the tv expensive. Are you getting a giant lcd tv or a smaller OLED? I spent more more money than normal on my oled and I’d say it’s worth it over the tv’s I’ve had in the past.
Classc diminishing returns curve
Seems like $1200-$1500 is the sweet spot
It’s impossible for it not to diminish in score, as you can’t go over 10. That, plus ratings often implicitly take into account price.
That trend line doesn’t look right. I don’t think it fits the data
This is light on analytics and heavy on generating revenue via affiliate links. Not much value-add vs just using the rtings site. Keep working at it.
That trendiness is a horrible fit. There’s nothing upward after 1500/2000. It’s linear first than flat.
That is a poor fitting model, that trend has plateaud
Something like this, you want to highlight the pareto frontier. Very cool content.
Now this is the analysis I need – a graph when I go buying. I bought the most optimal tv, but my cash got locked in and de-appreciated. So, unless I am renting that tv and earning i dont want it
That trend line doesn’t seem to particularly fit the data.Like, the trend ends significantly above the highest datapoint. The data looks linear and then very rapidly flattens out. The curve you’ve chosen to model the regression by just doesn’t seem correct to my eyes.
1500 is the value sweet spot.
It would be interesting to include features and compare their effect on price and ratings. As in, feature X increases the price by Y, and the rating by Z. It would show which features offer the biggest bang for your buck.
The biggest jumps in quality come from jumps in technology. OLED is better than regular LED. Differences within tech are more related to name brand, sometimes reliability or overall design.
Now that 98″ to 100″ TVs are affordable I wish they would test and rate those sized directly, instead of just assuming all sized are similar to the 65″ performance.
I think there are a couple factors that would be more important to break out.
Size vs price
Display vs price
Brand vs price
The interface one a 200 tv vs 2000 tv may be almost exact, because it can be across all models, while something like oled vs led vs etc. may be a better indicator of price/satisfaction.
$1000 to $1500 is the sweet spot. Not surprising though, there are some in pretty beautiful tvs in that price range. You can get mid to low end OLED and high end TCL/Hisense mini led tvs are amazing.
It’s hard to quantify something like a TV down on the high end, as they often target niches with leading edge standards, or form factors that are more bougie.
Like if you are spending $10k on a TV, you aren’t buying a 65″. Doesn’t matter what RTings says, you’ll be hunting for like a 85″+ 8k TV, which isn’t captured on this chart at all.
Who is paying more than 600 for a 65” tv? Just got mine from Costco online 4k qled smart tv for 250
I’m not sure that fit line is very accurate. Interesting though
I’d say 1000-1500 is a sweet spot if you are willing to spend a bit more
Yeah, that curve looks about what I’d expect. It does seem to be a great fit though
TVs have had such a drop in prices in the past 10 years its insane. This might be the only technology that’s gotten more affordable over time. You can walk into best buy and get a decent tv for 250, but 10 years ago you had to be willing to drop at least 6-700.
things that are used to me just about everyday i. life, and what I really know well, and are passionate about — I like to stop at that one little peak in the curve I think of as the prosumer level.
I’m a designer by trade so seeing things is what I get paid for at my day job. I see the LG C4 OLED in that area (love those inky blacks) as the end of the sweet spot for my eyes and budget. The G4, to go further up, is where things start to drop off for me. I’m can’t tell too much a difference for the price justification. Theres the high-end Sony MiniLEDs I’ve yet to see, but are very intrigued. But if I went miniLED its much easier to settle for a Samsung QN90D in the “is 1,000” more getting me that much. No in my case; but I do know visual folks with bigger wallets that I that can and will go for it.
Thats a great graph. [RTINGS is a wonderful reviewer](https://www.rtings.com/) and recommend a sub to them any chance I can.
It seems like you are best to spend somewhere between 1300 to 1500 dollars for your TV. That is like the sweet spot for value and a reputable TV. But that being said, sometimes it makes sense to buy last year’s model that was 2000+ dollars and now is in that 1300 to 1500 dollars range because it’s a year older. There aren’t enough upgrades each year to justify getting cutting edge OLED or micro led TVs. Last year’s model will be really good for most of us.
I feel like if you presented that curve as the best fit for that data in a college level course you would get a D at best.
You could create an indifference curve based on how much you value the rating vs the price of the TV and find the optimal price point for spending by finding where the curve is tangent to the regression in this data.
Paid $1600 for my LG C2… runs circles around the Sony I had both with Dolby vision and HDR
Comments are closed.