I’m a data analyst intern seeking full-time employment, and I figured the best thing to do was to expand my portfolio while job hunting. Since I love using local data, I wanted to create a dashboard that visualizes the gun incidents in my city going back to 2010.
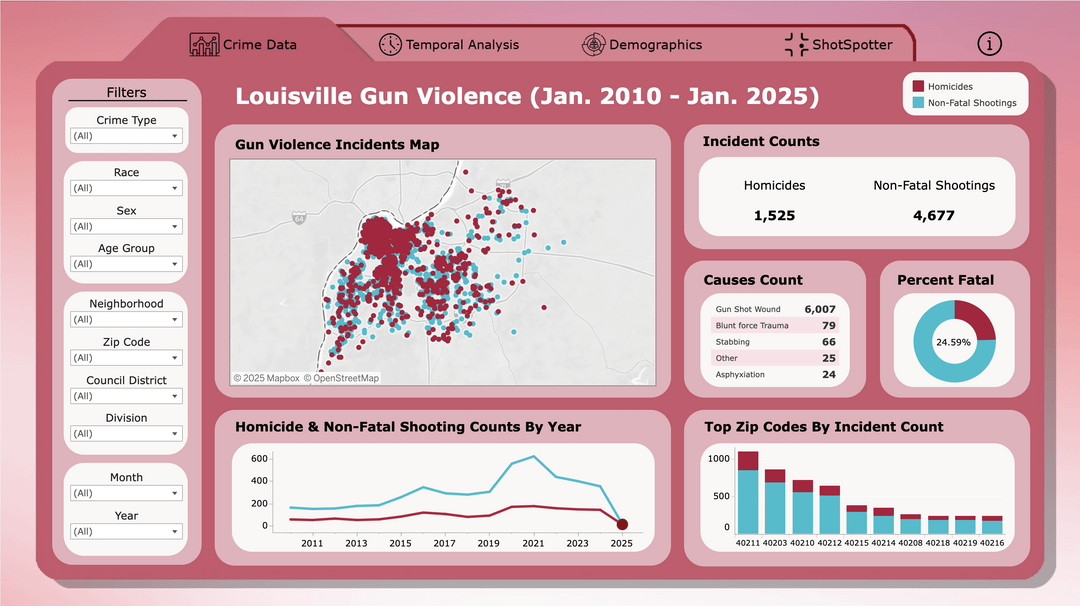
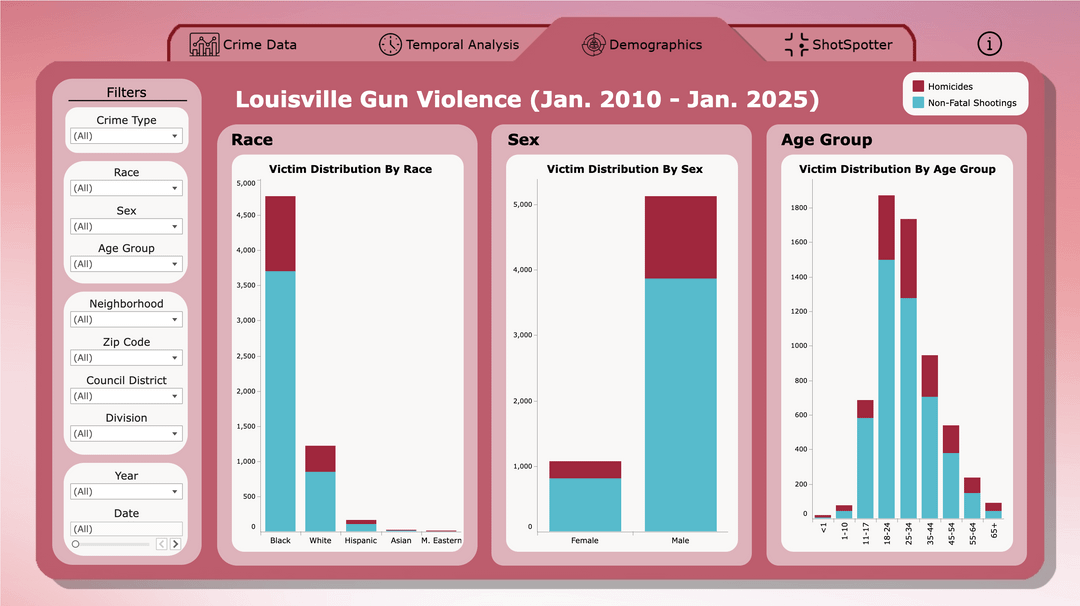
I was particularly excited to work on this dashboard because, for years, I’ve heard that my city has a gun violence problem. I wanted to be sure to answer the key questions: **who is it happening to, where is it happening, and when is it happening?** This dashboard allows you to drill down into the data to explore details like the time of day, day of the week, seasonal trends, and other important patterns.
In the next few days, I will automate the dashboard so that it is updated each night. Currently it’s just a 15-year snapshot of gun violence in my city.
Key Insights:
– 2021 was the peak year for homicides and non-fatal shootings. We’ve been in a downtrend since. If you zoom out, you’ll see we are still trending upwards when compared to 2019 and before.
– Nearly 25% of gun violence incidents are fatal.
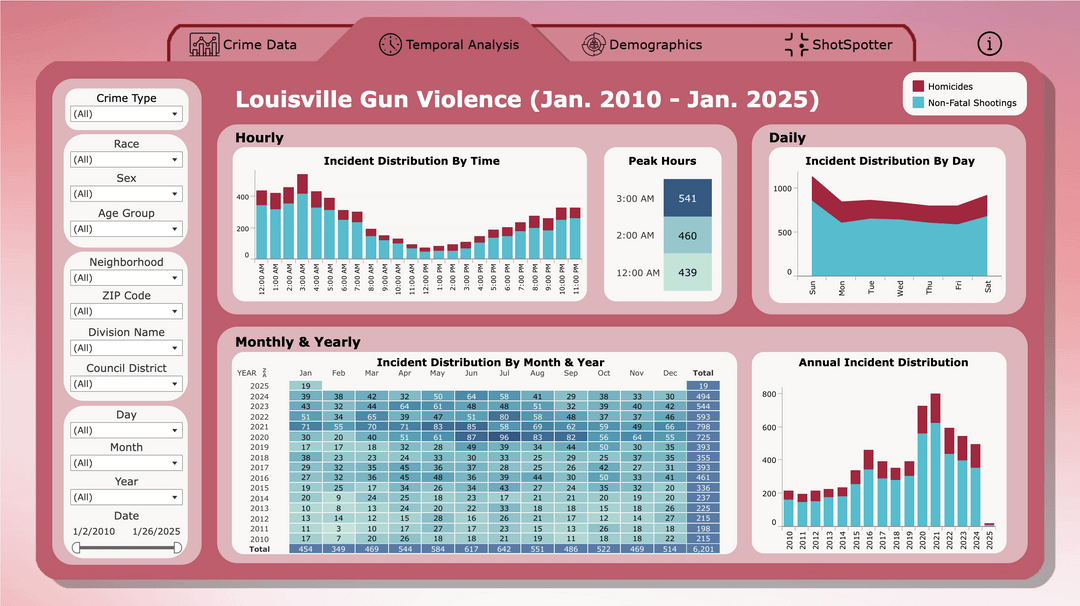
– Peak hour: 3:00 AM
– Peak day: Sunday
– Peak month: July. (April-August all have 500+ incidents going back to 2010).
– Black victims make up 77% of the total.
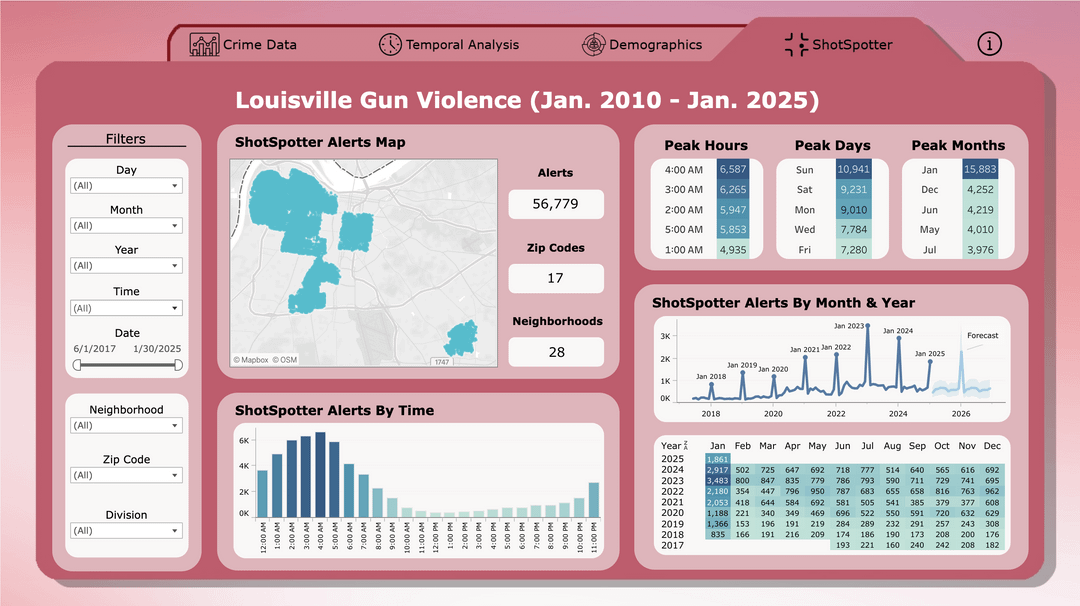
– This past January 1st, 1,861 shots were detected by ShotSpotter. This is 1,056 less than January 1st 2024 and 1,622 less than January 1st 2023.
Damn… Are these normal numbers for a 700k city in the US? 😶
I’m confused by the “causes” category. For example stabbing. Was somebody stabbed by a gun? Or were they stabbed and the assailant also had a gun so it counts as a gun crime?
Glasgow, Scotland was known as the murder capital of Europe.
Its homicide rate was ten times lower than this.
I wonder how many of these incidents were related to drugs or alcohol.
Cool (but sad) viz. Why the big spikes in January each year? Festive season?
Does this include self-inflicted injuries, and if so, how does it impact the data if you remove them.
I don’t think the reddit mods will allow this.
You might find this interesting. Overlay this data with hospital locations. Specifically, hospitals with level 1 trauma centers.
You will find a correlation between proximity and homicide.
Dam middle eastern terrrrerestssss causing 0.0001% 🔫
10 comments
Source: [Louisville Metro KY – Gun Violence Data](https://data.louisvilleky.gov/datasets/LOJIC::louisville-metro-ky-gun-violence-data/about)
Tool: Tableau
I’m a data analyst intern seeking full-time employment, and I figured the best thing to do was to expand my portfolio while job hunting. Since I love using local data, I wanted to create a dashboard that visualizes the gun incidents in my city going back to 2010.
I was particularly excited to work on this dashboard because, for years, I’ve heard that my city has a gun violence problem. I wanted to be sure to answer the key questions: **who is it happening to, where is it happening, and when is it happening?** This dashboard allows you to drill down into the data to explore details like the time of day, day of the week, seasonal trends, and other important patterns.
In the next few days, I will automate the dashboard so that it is updated each night. Currently it’s just a 15-year snapshot of gun violence in my city.
Key Insights:
– 2021 was the peak year for homicides and non-fatal shootings. We’ve been in a downtrend since. If you zoom out, you’ll see we are still trending upwards when compared to 2019 and before.
– Nearly 25% of gun violence incidents are fatal.
– Peak hour: 3:00 AM
– Peak day: Sunday
– Peak month: July. (April-August all have 500+ incidents going back to 2010).
– Black victims make up 77% of the total.
– This past January 1st, 1,861 shots were detected by ShotSpotter. This is 1,056 less than January 1st 2024 and 1,622 less than January 1st 2023.
Tableau link: [https://public.tableau.com/app/profile/stefan.v/viz/LouisvilleGunViolence/CrimeData](https://public.tableau.com/app/profile/stefan.v/viz/LouisvilleGunViolence/CrimeData)
Damn… Are these normal numbers for a 700k city in the US? 😶
I’m confused by the “causes” category. For example stabbing. Was somebody stabbed by a gun? Or were they stabbed and the assailant also had a gun so it counts as a gun crime?
Glasgow, Scotland was known as the murder capital of Europe.
Its homicide rate was ten times lower than this.
I wonder how many of these incidents were related to drugs or alcohol.
Cool (but sad) viz. Why the big spikes in January each year? Festive season?
Does this include self-inflicted injuries, and if so, how does it impact the data if you remove them.
I don’t think the reddit mods will allow this.
You might find this interesting. Overlay this data with hospital locations. Specifically, hospitals with level 1 trauma centers.
You will find a correlation between proximity and homicide.
Dam middle eastern terrrrerestssss causing 0.0001% 🔫
Comments are closed.