Exposure to particulate matter 1,2,3,4. The distribution of PM2.5 is highly uneven across space and time, with disproportionate exposures in specific regions and populations. Many studies have assessed these disparities5,6,7,8,9,10, but they use different analytical units (e.g., county or zip code) and indicators (e.g., Decile Ratios or Atkinson Index) across a limited set of regions. These varied approaches have prevented a comprehensive description of the inequalities in global PM2.5 distribution and the dynamics over time.
This brief paper presents the state of PM2.5 exposure inequalities and the associated trends from 2000 to 2019. We fused the PM2.5 concentration and population distribution datasets and calculated the experienced PM2.5 exposure by different populations in 1 km × 1 km grids. Based on population PM2.5 exposure, the Gini index was used to measure the global, intra-country and subnational PM2.5 inequalities. Unlike previous studies that primarily decompose global inequality into within-country and between-country components11, our study further identifies the mechanisms through which national contributions shape global disparities.
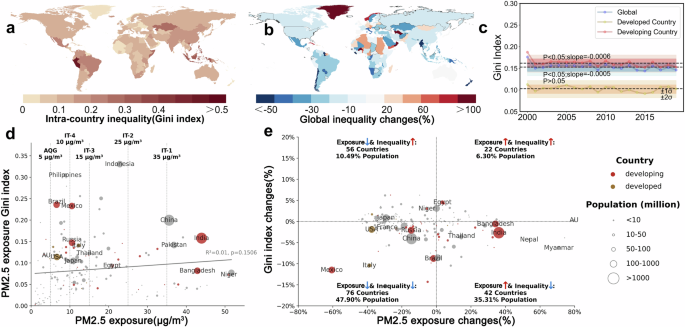
We find that the intra-country PM2.5 inequalities (Fig.1a–c) significantly decreased since 2000. The intra-country Gini index ranged from 0.001 in Tonga to 0.530 in Peru, and the population-weighted average of all countries decreased from 0.176 in 2000 to 0.146 in 2019 (−2 × 10⁻⁴ Gini/year, P
a–c PM2.5 exposure intra-country Gini indices mean, change and time series. d Distribution of intra-country Gini indices as a function of PM2.5 exposure. e Distribution of intra-country Gini indices changes as a function of PM2.5 exposure changes. In (c, e) significance of time series trends are evaluated by MK-test, and countries with significant trends are presented in black border or red/yellow colors. The dynamics of intra-country Gini indices and socio-demographic development from 2000 to 2019 are shown in (Supplementary Figs. 5, 6).
We plotted the distributions of PM2.5 inequalities as a function of PM2.5 exposures (Fig. 1d). In many cases, countries with high PM2.5 exposures tended to have higher Gini indices. Examples include India (PM2.5: 50.83 μg/m³, Gini: 0.381) and China (PM2.5: 33.23 μg/m³, Gini: 0.414). However, the correlations between PM2.5 exposures and PM2.5 inequalities were not statistically significant (P = 0.15). Some countries, such as Bangladesh and Niger, had high PM2.5 exposures but low inequalities. This indicated that their populations are equally exposed to high PM2.5 levels. Only 1.21% of the world population lived within areas meeting World Health Organization (WHO) air quality guidelines (AQG of 5 μg/m³). The following percentages of the global population were exposed to the following WHO interim targets (IT): 13.07% within IT-4 (10 μg/m³), 25.13% within IT-3 (15 μg/m³), 42.22% within IT-2 (25 μg/m³), and 54.02% within IT-1 (35 μg/m³). Over 33.6% of the global population was exposed to PM2.5 levels that were above 50 μg/m³ with 10 times the AQG (Supplementary Fig. 3–4).
With respect to the dynamics of PM2.5 inequalities (Fig. 1e), 76 countries representing 47.9% of the global population experienced reductions in both PM2.5 inequalities and exposures. In contrast, 22 countries representing 6.3% of the global population experienced increasing PM2.5 exposures and exposure inequalities. While 42 countries (e.g., India and Myanmar) reduced inequalities coincide with increasing PM2.5 exposures, indicating populations in these countries are more uniformly exposed to higher pollution levels.
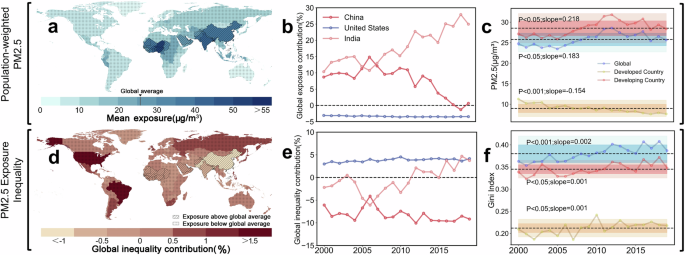
In contrast to easing intra-country PM2.5 inequalities, the global PM2.5 inequality significantly intensified. The global inequalities (Fig. 2f) associated with global PM2.5 exposure (Fig. 2c) showed a significant increasing trend (0.002 Gini/year, P 2c): the PM2.5 exposure in developed regions experienced a significant decreasing trend (−0.154 μg/m³/year, P P
Mean PM2.5 exposure (a) and inequality contributions (d) by countries from 2000-2019. b, e Temporal trends of contributions to global PM2.5 exposure (c) and inequality (f) from China, the United States, and India. c, f Temporal trends in PM2.5 exposure (b) and intra-region inequality (e) for developed and developing regions.
We also divided the global population into subgroups (populations from developed and developing regions). The inequalities were more pronounced among populations from developing region, with a Gini index that was 63.18% (95% CI = [61.07%,65.29%]) higher compared to developed region. Both population subgroups showed a significantly increasing trend in PM2.5 exposure inequalities, with increases of 1.2 × 10⁻³ and 1.5 × 10⁻³ in the Gini index per year (P
Primary contributors to global inequality in 2019 (Supplementary Fig. 10) include United States (4.15%), India (3.74%), and China (−9.16%). There are two mechanisms of elevating global inequality: contributing significant above or below global average exposure population (Fig. 2d). For example, India elevated global exposure by 24.96% in 2019 (from 20.53 μg/m³ to 24.96 μg/m³, Supplementary Fig. 9a) and elevated global inequality by 3.74%. The United States elevated global inequality (Fig. 2e) by 4.14% with a different mechanism. It contributed significant share of low-exposure population and reduced the global exposure by approximately 0.92 μg/m³ (3.45%). China experienced a two-phase trajectory (Fig. 2b) with contribution reduced from 9.99% (2000–2013) to 2.15% (2014–2019). China also maintained a mitigating effect (Fig. 2e) to global inequality by bridging population between high (e.g., India) and low (e.g., United States) exposure regions (Supplementary Fig. 8).
This study’s results show a mixed trend in global PM2.5 inequality dynamics. While there has been significant progress in reducing PM2.5 inequalities within countries, global disparities between countries increased after 2000 due to the widening gaps between developing and developed regions. This highlights the need for targeted interventions that address overall PM2.5 pollution within countries and disparities between countries. Most developed countries with advanced cleaner technologies and strict environmental policies have generally made progress with respect to decreasing PM2.5 exposures and reducing exposure inequalities. In contrast, many rapidly developing countries face challenges balancing economic growth with environmental protection, often prioritizing economics over the environment. Aggressive urbanization and industrialization in many developing countries have contributed to increasing PM2.5 exposures in densely populated areas. This further exacerbates existing socioeconomic inequalities by marginalizing already vulnerable low-income countries that are least equipped to adapt due to poor healthcare infrastructure. The increasing PM2.5 inequalities between countries highlight the need for international cooperation beyond intra-country efforts. Developing countries may benefit from clean technology transfers, environmental research collaboration, and knowledge sharing concerning PM2.5 reduction practices from developed countries. Our findings further reveal distinct national pathways shaping global inequality. The two-phase transition of China’s clean air policy significantly impacted global PM2.5 exposures and mitigated global inequality. These trends illustrate how environmental policy changes in major economies can rapidly reshape global inequality patterns. Therefore, establishing a harmonized global PM2.5 inequality monitoring mechanism is critical to track progress toward environmental justice and identify vulnerable populations or areas needing additional support and resources.

