Significant diversity was observed among Iranian oak (Quercus brantii Lindl.) populations in terms of morphological traits, allowing for selection of these traits across different populations (Table 3). The findings from the mean comparison across the investigated groups indicated that the highest fresh leaf weight was in the YAS population (1.17 g), and the lowest was in the BAN population (0.24 g). The comparison of dry leaf weight indicated that the YAS population had the highest average dry leaf weight (0.76 g), while the BAN population had the lowest (0.10 g). The mean comparison of fresh fruit weight showed that the BAN population had the highest average (13.45 g), and the TEH population had the lowest (2.29 g). In terms of dry fruit weight, the TEH population had the lowest average (1.28 g), while the BAN population had the highest (9.20 g). Leaf length varied between 5.32 and 10.3 cm, and leaf width varied between 2.19 and 6.75 cm. The YAS population had the longest fruit length (4.85 cm), while the TEH population had the shortest (1.83 cm). The largest fruit diameter was found in the BAN population (2.44 cm), and the smallest in the TEH population (0.65 cm) (Table 4; Fig. 2). Earlier research has consistently shown the extensive variation in morphological traits among Quercus sp. populations33,34,35,36. Khadivi et al.36 noted that the wild edible fruits of these plants exhibit significant genetic diversity. This indicates that wild species may play a crucial role in the genetic diversity of crops37. Furthermore, the natural process of repeated dispersal of wild fruit seeds promotes their genetic variability.
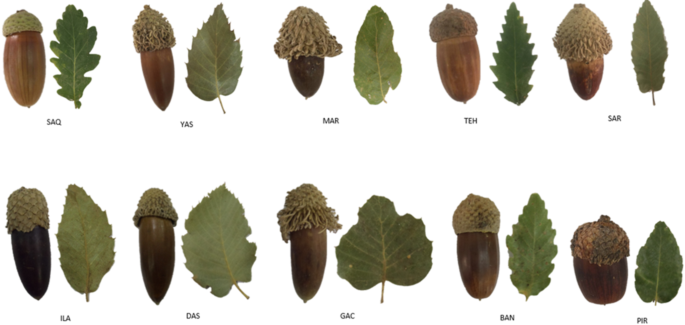
Diversity of fruits and leaves in the collected populations of Quercus brantii Lindl.
Phytochemical traitsTotal phenolic and total flavonoid content
The total phenolic and flavonoid concentrations were determined using the Folin-Ciocalteu reagent method and the aluminum chloride method, respectively. Notable variations in the total phenolic and flavonoid levels of the fruit extract were detected among different oak populations (P 3). According to a study by Maslova et al.37, the highest known concentration of total phenolic compounds in acorns was found in Quercus suber, with a remarkable value of 233,350 mg per 100 g of dry weight. In contrast, Tejerina et al.38 observed a comparatively lower content of total phenolic compounds, ranging from 840 to 9163 mg/100 g DW, in the acorns of Quercus rotundifolia. This variation was attributed to the timing of seed harvest throughout the year and over two consecutive years, suggesting that the composition of acorns varies with their maturity level and indicating an ongoing maturation process both during tree growth and post-harvest38,39.
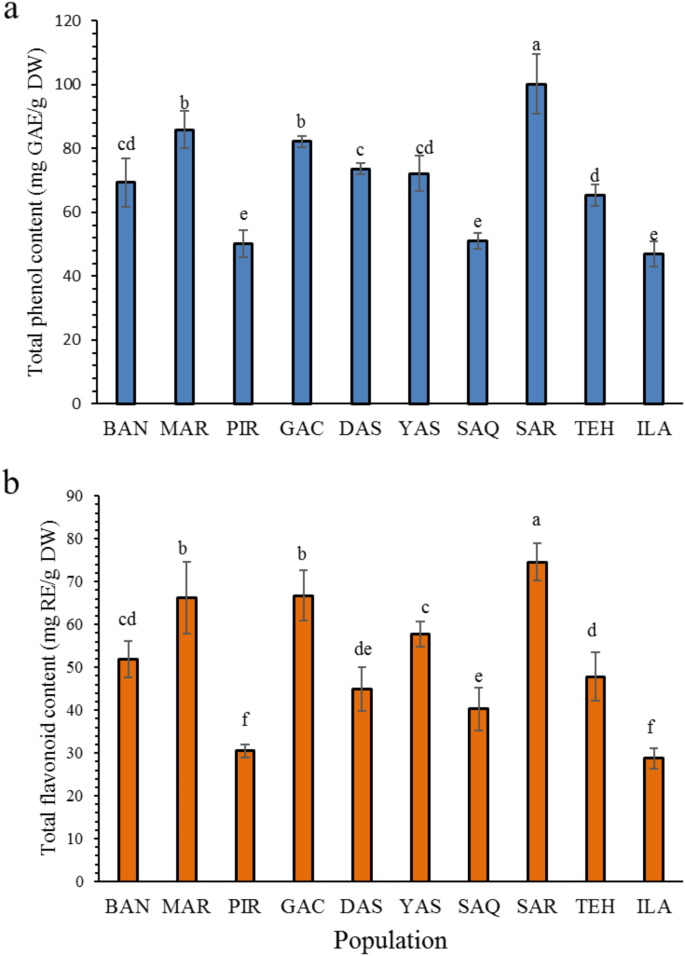
Histogram of total phenol content (a) and total flavonoid content (b) among Quercus brantii Lindl. populations.
Polyphenolic compounds exhibit robust antioxidant activity attributed to their proficiency in capturing free radicals. and form complexes with metal ions, a property attributed to their chemical structure. Various methods exist for producing polyphenolic constituents in plants, and their arrangement within plant tissues is governed by multiple mechanisms. Several factors, including genetic factors, environmental and climatic conditions, as well as the choice of extraction solvent, significantly influence the concentration of phenolic and flavonoid compounds in plants40. Flavonoids form the largest category of naturally occurring phenolic substances found throughout different parts of plants and possess numerous biological activities41. The SAR population exhibited the highest average of 74.06 mg RE/g DW in total flavonoid content, while the ILA and PIR populations had the lowest (30.48 and 28.78 mg RE g DW, respectively) (Fig. 3). Taib et al.42 indicated that Q. faginea had a total flavonoid content of 6.2 mg/g of dry extract, while Q. rotundifolia had 10.3 mg/g. Seasonal fluctuations and the various stages of maturity have consistently been identified as influential factors in the variability of phenolic and flavonoid compounds within Quercus species43,44,45. However, the majority of research on Quercus brantii extracts has primarily focused on comparing the compositional differences of these compounds among different plant parts or in relation to other Quercus taxa.
Polyphenolic compounds and flavonoids possess a chemical structure that enables them to neutralize free radicals, resulting in significant antioxidant properties. The fruits obtained from the investigated Iranian oak populations displayed a diverse array of phenolic and flavonoid compounds. Plants synthesize these polyphenolic compounds through a variety of mechanisms. Furthermore, the distribution of these compounds across different plant tissues varies46. The extraction of phenolic and flavonoid compounds from plants is significantly impacted by various factors, with environmental and climatic conditions being among the most influential determinants of their concentrations47.
Antioxidant activity
The assessment of antioxidant capacity through the DPPH radical method is a widely recognized assay for measuring the antioxidant potential of different compounds. This technique relies on the ability of antioxidants to reduce the DPPH free radical in an environment devoid of other free radicals. A significant variation in antioxidant activity was observed among the different oak populations (Fig. 4). According to the results, the percentage of DPPH free radical inhibition ranged from 5.52 to 18.65% across the populations. The ILA, SAQ, and PIR populations (with the highest IC50 values) exhibited the lowest antioxidant activity, whereas the GAC, SAR, and MAR populations, with the lowest IC50 values, demonstrated the strongest antioxidant activity. Variability in acorn extract properties likely reflects differences in nutritional and phytochemical profiles. High phenolic content is consistently linked to enhanced antioxidant capacity in acorn extracts21,48. Numerous studies have found a consistent positive association between the antioxidant activity and total phenolic content of fruits and vegetables, indicating that the phenolic compounds present in these foods are key contributors to their overall antioxidant potential19,42,49. Antioxidants are incorporated into food products to mitigate degradation resulting from the oxidation of unsaturated fats. There has been a growing preference for natural antioxidants over synthetic alternatives due to their reduced side effects. As a result, there has been an increased emphasis on the discovery of natural antioxidants compared to previous years. In contrast, synthetic antioxidants have been associated with adverse effects on the blood coagulation, thyroid, liver, lungs, as well as exhibiting carcinogenic properties. Phenolic compounds are the primary constituents of natural antioxidants, and these compounds are prevalent in numerous medicinal plants47. Research has consistently shown that extracts rich in phenolic compounds exhibit significantly enhanced antioxidant properties compared to those with lower phenolic content, underscoring the key role of these compounds in mediating antioxidant activity50.
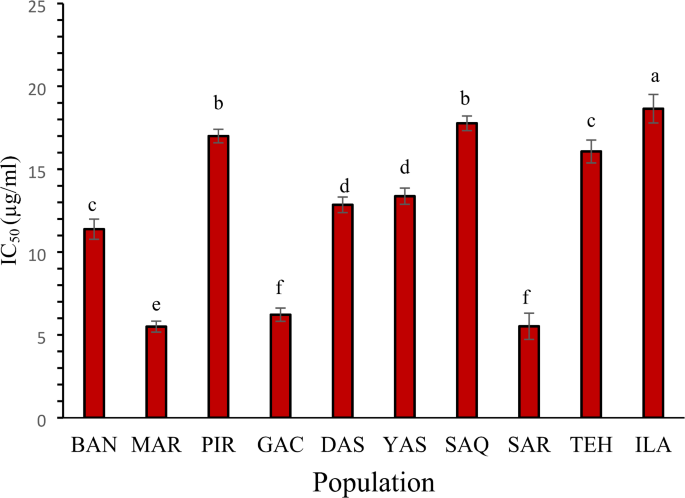
Histogram of antioxidant activity among Quercus brantii Lindl. populations.
Tannin content
The tannin content in various populations was measured using methanolic extracts based on the Folin-Ciocalteu method. Based on the findings, the maximum total tannin content was recorded in the SAR (56.60 mg GAE/g DW), MAR (48.29 mg GAE/g DW), and GAC (47.05 mg GAE/g DW) populations, while the lowest total tannin content was found in the ILA (26.87 mg GAE/g DW), PIR (27.25 mg GAE/g DW) and SAQ (27.95 mg GAE/g DW) populations (Fig. 5). Phenolic compounds are among the most complex plant compounds, recognized as protective agents against free radicals. The category of phenolic compounds consists of simple phenols, phenolic acids, quinones, tannins, coumarins, and flavonoids. Tannins are a general term for a large group of polymeric phenols, with molecular weights ranging from 500 to 300051. In a study by Rakić, et al.52, the total tannin content in the acorns of Quercus robur was found to be 20,400 mg per 100 g DW. Tejerina, et al.38 reported that the acorns of Quercus rotundifolia contained 950–1150 mg of hydrolyzable tannins per 100 g DW, along with 50–140 mg of condensed tannins per 100 g DW. Among the hydrolyzable tannins, gallotannins were measured at levels reaching 860 mg/100 g DW, while ellagitannins were found at up to 290 mg/100 g DW. Hydrolyzable tannins are primarily found in sources such as oak, grape seeds, and pomegranate peels, which are not easily incorporated into a regular diet53. As a result, there is a need for a plant rich in Hydrolyzable tannins, along with efficient extraction methods to meet growing demand. Research has revealed that oak species contain a significant proportion of Hydrolyzable tannins in their tissues54,55. The high tannin content, ample reserves, and easy availability of oak raw materials have made oaks a focus of interest.
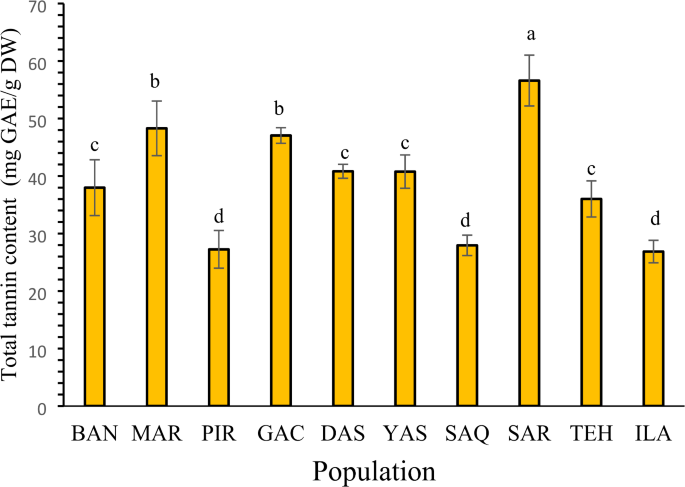
Histogram of total tannnin among Quercus brantii Lindl. populations.
Phenolic compounds
To investigate the phenolic acid content of different oak populations, 14 standard (gallic acid, 3,4-dihydroxybenzoic acid, chlorogenic acid, vanillic acid, salicylic acid, p-coumaric acid, caffeic acid, rosmarinic acid, benzoic acid, syringic acid, ferulic acid, kaempferol, quercetin, and rutin) phenolic compounds were analyzed using HPLC. A total of four principle phenolic compounds were identified: gallic acid, salicylic acid, rosmarinic acid, and rutin (Figs. 6 and 7). The content of gallic acid ranged from 1.10 to 5.22 mg/g dry weight across the various oak populations, with the DAS population exhibiting the highest concentration and the TEH population showing the lowest (Table 5). The concentrations of ellagic and gallic acids in acorns are closely associated with the tannin content, as these acids are released through processes including temperature exposure, enzymatic activity, and the influence of acids and alkalis, among other factors39.
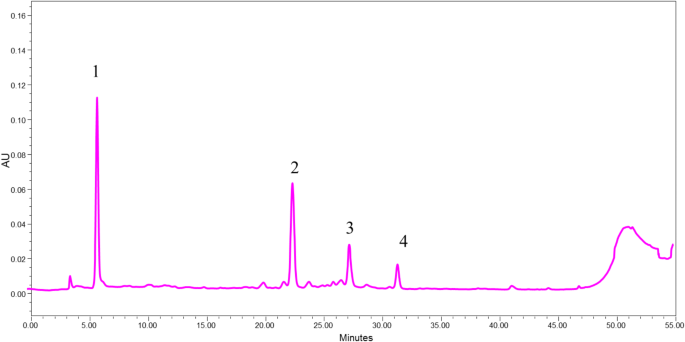
The HPLC-PDA chromatogram of Quercus brantii Lindl. extract in PIR population (visualized at 254 nm) (1: gallic acid; 2: rutin; 3: rosmarinic acid; 4: salicylic acid).
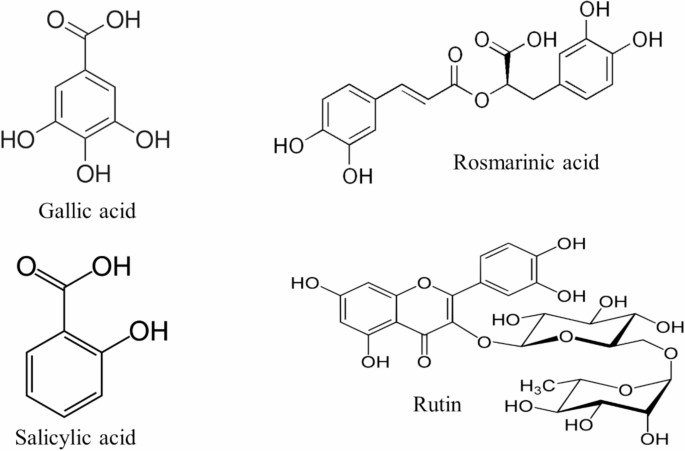
Chemical structures of the main phenolic compounds found in Iranian oak (Quercus brantii Lindl.)
The highest salicylic acid (SA) concentration was noted in the BAN population (0.87 mg/g DW), while negligible amounts were detected in the ILA, TEH, DAS, GAC, and PIR populations. Skwarek-Fadecka’s findings indicate that reactive oxygen species (ROS) can stimulate the production and accumulation of SA, a phytohormone that participates in the process of developing systemic acquired resistance in plants56. SA plays a pivotal role in the signaling pathways activated in response to the recognition of pathogen-associated molecular patterns in plants, serving as a critical mediator of plant defense response. These hormones are involved in various signaling pathways57,58,59. Rosmarinic acid (RA) was only detected in the PIR population (0.54 mg/g DW). RA and coumarins had previously only been detected in Quercus glabrescens, which suggests their potential as species-specific markers60. This study represents the first report of RA presence in Iranian oak. The rutin content varied from 0.34 to 2.71 mg/g DW, with the lowest concentration found in the SAQ population and the highest in the GAC population. Rutin is recognized for its P-vitamin activity, its ability to enhance blood vessel elasticity, and its notable antioxidant, antitumor, and radioprotective properties61. The phenolic profiles vary greatly among species. In a study conducted on the leaves of five different Quercus species (Q. acuta, Q. glauca, Q. myrsinifolia, Q. phylliraeoides, and Q. salicina), authors reported high levels of gentisic and chlorogenic acids, as well as of the flavonoids naringin and rutin in Q. salicina; but none of these compounds was detected in any other Quercus species62. On the other hand, Brossa et al.63 reported flavanols as the major constituents in holm oak (Q. ilex) leaves. Likewise, Cantos et al.64 reported different gallic acid derivatives in Q. ilex, Q. rotundifolia, and Q. suber.
Correlation and multivariate analyses
The fresh leaf weight shows a significant and positive correlation at the 5% level with dry leaf weight and leaf width. However, it does not show a significant correlation with fresh fruit weight, dry fruit weight, leaf length, fruit length, fruit diameter, total phenolic content, total flavonoid content, total tannin content, or antioxidant activity (IC50). Antioxidant activity is positively and significantly correlated at the 5% level with total phenolic content, total flavonoid content, and total tannin content. Fresh fruit weight is positively and significantly correlated at the 5% level with dry fruit weight, fruit length, and fruit diameter, but it does not show a significant correlation with other traits (Fig. 8). The overall yield of phytochemicals from a plant is determined by the effectiveness of its specialized organs, which are specifically adapted for the synthesis and accumulation of these valuable compounds, and because the metabolites of the Iranian oak are primarily formed in its fruit, any factor that increases fruit yield in this plant can effectively enhance metabolite production. Therefore, traits that influence the increase in fruit weight should be considered by breeders61.
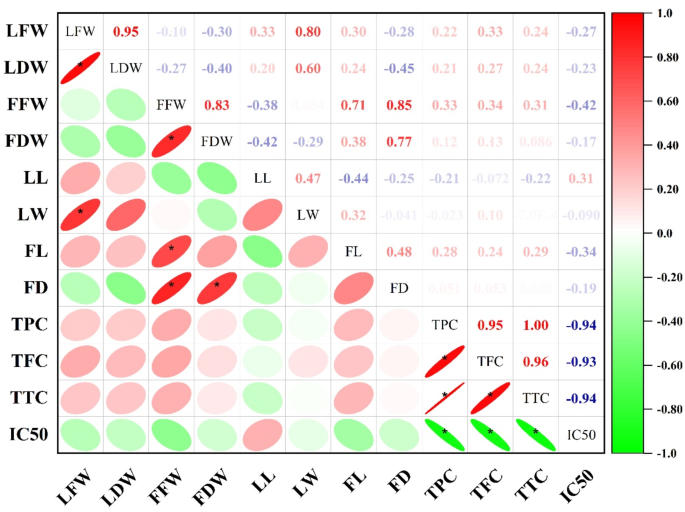
Linear correlation between the morphological and phytochemical traits of Quercus brantii Lindl. populations. Significant difference in 5% level.
Cluster analysis, a key technique for categorizing various populations based on their morphological and phytochemical characteristics, was performed (Fig. 9). The findings indicated that the populations were classified into three primary groups. Group A included four populations, BAN, YAS, DAS, and THE which were superior in traits such as fresh and dry fruit weight, fresh and dry leaf weight, and fruit length and diameter compared to the other populations. Groups B and C each contained three populations. Populations MAR, GAC, and SAR were placed in Group B, and populations PIR, ILA, and SAQ were in Group C. Populations in Group B were superior in phytochemical traits, including total phenolic content, total flavonoid content, tannin content, and antioxidant activity, whereas populations in Group C had the lowest levels of phytochemical compounds. The impact of environmental and geographical factors on gene expression levels, as well as the diversity of morphological traits and phytochemical compounds among plant populations, is well-recognized. Diversity within plants of the same plant species is affected by environmental factors and gene structure, as demonstrated by cluster analysis, where similar populations are positioned close to each other47.
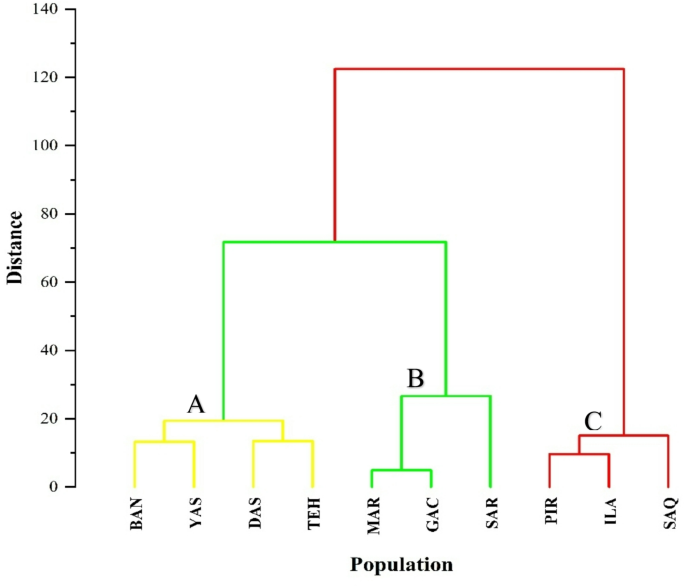
Dendrogram from cluster analysis of morphological and phytochemical traits of Quercus brantii Lindl. populations based on Ward’s method.
The biplot generated using the first (PC1) and second (PC2) principal components demonstrated the diversity among the populations and divided them into two main groups (Fig. 10). The first and second components accounted for 38.52% and 30.01% of the total variance among the populations, respectively. The biplot derived from morphological and phytochemical traits corroborated the findings from the cluster analysis. In the study by Eghlima et al.65, PCA was used to evaluate different ecotypes of Equisetum arvense, where the morphological traits under study were categorized into three principal components, collectively accounted for 96.77% of the total variance. In another study on Rosa canina, morphological and phytochemical traits were classified into seven principal components using PCA, accounting for 93.53% of the total variance41.
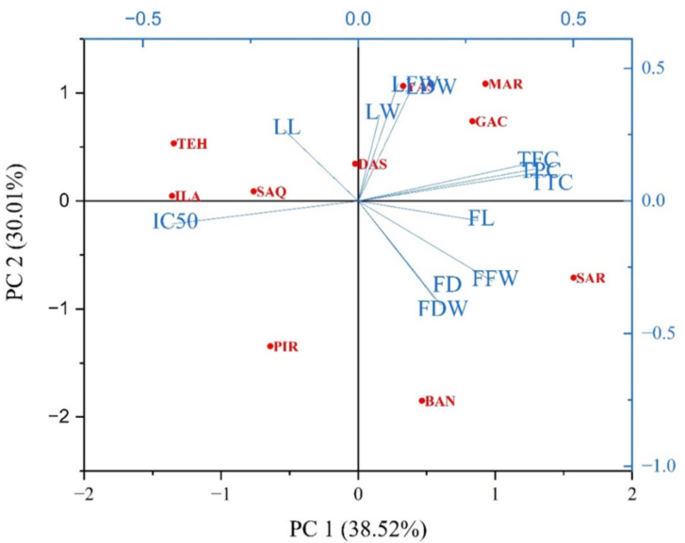
Bi-plot analysis of phytochemical and morphological traits in Quercus brantii Lindl. populations.
Cytotoxicity assay
The diverse traditional uses and abundant phytochemical composition of the Quercus genus make these plants noteworthy for biological and toxicological studies. The MTT assay were performed to evaluate the inhibitory effect of acorn extracts from different oak populations on the viability of normal cell line (HDF) and gastric cancer cells (MKN45). The survival rate of HDF cells varied between 79.06 and 90.75% under the influence of various extracts. In addition, the survival rate of MKN45 cells was between 74.69 and 88.57% (Fig. 11). All the extracts demonstrated minimal cytotoxicity against the normal cell line. This suggests that these extracts may be relatively safe for non-cancerous cells. Oak various parts and products especially its fruits are used traditionally in Iranian herbal medicine to alleviate inflammation and pain and other ailments of gastro intestinal tract. MKN45 cell line is an established cell line for gastric cancer. Previous studies especially on oak fruit (acorn) extracts reported that it has moderate anti proliferative effect on AGS (a gastric cancer cell line). Therefore, in this study we tried to examine the anti-proliferative effect of extracts obtained from acorns on MKN45 gastric cancer cell line. However, our findings did not show significant cytotoxicity toward MKN45 cells66,67. Certain plant antioxidants are believed to play a role in their anti-cancer properties, and it has been reported that their flavanols can inhibit the growth of cancer cells in laboratory settings67,68.
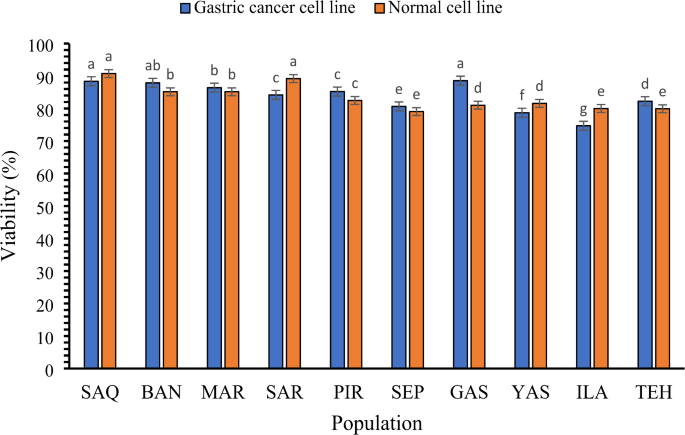
Cytotoxic activity against normal cell lines (HDF) and gastric cancer cells (MKN45) of extracts of the studied populations of Quercus brantii Lindl.