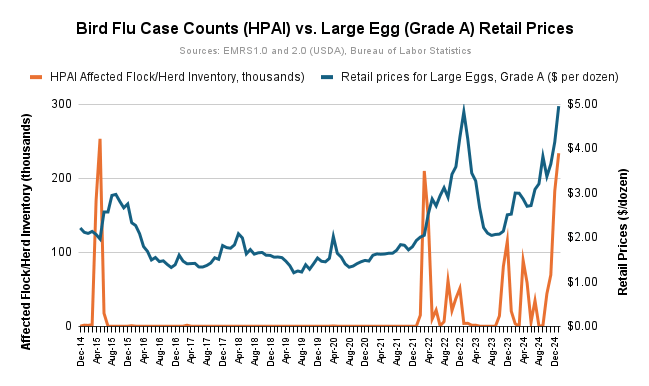
Not sure the data exists, but I’d be curious to see an added line for hens culled, which more directly influences prices than just case counts.
Tucking Trump should have done something months ago. Bastard.
but Reddit tells me it’s all Trump’s fault…
It takes a year to replace a laying hen, and only 6 weeks for a fryer. Egg prices will be reflecting the supply shortfall for a while.
I don’t really see the summer 2023 spike reflected in this graph. I don’t really remember a 2022 spike being near as bad as the graph depicts but I remember 5 dozen being $20 at Walmart in June 2023. Then declining rapidly to $4.97 by August.
As the egg prices idiots were told.
Eggs are twelve dollars a dozen where I live in NYC. Insane
Trump has been been in power for a month, blaming him for egg prices now is pretty ridiculous. Give him at least a year.
This is what all the fuss is about?! Your eggs are still cheap.
10 comments
Data Sources: [https://www.aphis.usda.gov/livestock-poultry-disease/avian/avian-influenza/hpai-detections/commercial-backyard-flocks](https://www.aphis.usda.gov/livestock-poultry-disease/avian/avian-influenza/hpai-detections/commercial-backyard-flocks) and [https://www.bls.gov/charts/consumer-price-index/consumer-price-index-average-price-data.htm](https://www.bls.gov/charts/consumer-price-index/consumer-price-index-average-price-data.htm)
Tool Used: Google Sheets, lol
Not sure the data exists, but I’d be curious to see an added line for hens culled, which more directly influences prices than just case counts.
Tucking Trump should have done something months ago. Bastard.
but Reddit tells me it’s all Trump’s fault…
It takes a year to replace a laying hen, and only 6 weeks for a fryer. Egg prices will be reflecting the supply shortfall for a while.
I don’t really see the summer 2023 spike reflected in this graph. I don’t really remember a 2022 spike being near as bad as the graph depicts but I remember 5 dozen being $20 at Walmart in June 2023. Then declining rapidly to $4.97 by August.
As the egg prices idiots were told.
Eggs are twelve dollars a dozen where I live in NYC. Insane
Trump has been been in power for a month, blaming him for egg prices now is pretty ridiculous. Give him at least a year.
This is what all the fuss is about?! Your eggs are still cheap.
Yours, Switzerland.
https://www.migros.ch/en/category/dairy-eggs-fresh-convenience-foo/milk-butter-eggs/eggs – floor of $0.50 per egg for domestic production.
Comments are closed.