
The quality of the energy time series is e.g. related to the accuracy of the energy meters. Table 6 evaluates the reliability of the meters for electricity and heating.
Data from main meters (AMS-meters) and district heating meters (where available) are generally considered trustworthy due to their high precision and reliability. These meters are typically installed to meet strict industry regulations, ensuring accurate measurements of energy consumption or production for billing of costumers.
On the other hand, data from sub-meters, while still valuable, may require additional evaluation before being used in further research or analysis. The reliability of sub-meter measurements can vary. Therefore, it is essential to assess the quality of data from sub-meters on a case-by-case basis. In some instances, certain periods of measurements from sub-meters may need to be discarded if they are deemed unreliable or if there are indications of measurement errors. The same considerations should be made when downsampling the data, as periods of missing data could affect the outcome.
An example of how the quality of main meters and sub meters may vary is shown in Fig. 3 which illustrates all meter values for building_6397, a school equipped with a ground-source heat pump, electric boiler, and PV panels. The figure depicts hourly measurements of weather data alongside readings from energy meters. The electricity meters ElImp (total import) and ElBoil (electricity for the electric boiler, measured by an AMS-meter), exhibits complete data series with minimal errors and periods of missing data. The heat pump meter (ElHP), with measurements collected from a sub-meter and not an AMS-meters, displays periods of missing data. While some periods of missing data are expected, such as during summer months when the school is closed and thermal demand is negligible, sudden missing values during other periods likely stem from measurement errors. Regarding the electricity generation meter (ElPV), missing values are observed until the final year of the measurement period. This is due to the PV panels not being installed until 2021.
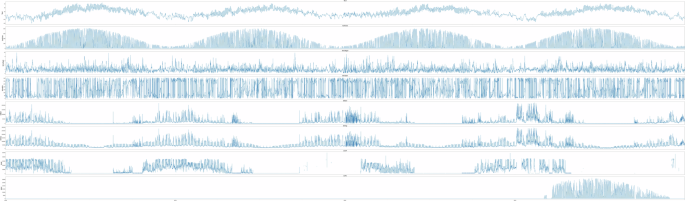
building_6397, a school building with ground source heat pump, electric boiler and PV-panels.
As we can see here, the submeters still contain valuable information, but not for the whole measurement period. If this data is to be used in for example training of disaggregation algorithms or other machine learning problems, it may be beneficial to extract only the periods from the dataset where measurements are available for all meters.
Supplementary Table 1 provides a detailed overview of the energy meters included in each building file. It includes the proportion of the time series during which each meter contains data and the sum of values for all columns representing energy consumption. Additionally, it presents results for an artificial meter, “ElRest”, which calculates the hourly difference between the imported electricity (“ElImp”) and the total electricity consumption recorded by the sub-meters. If the photovoltaic electricity generation (“ElPV”) is present, it is added to the imported electricity in the calculation. The purpose of “ElRest” is to show the share of total electricity consumption that is not captured by the sub-meters. However, for some buildings, there are instances where “ElRest” contains negative values. These anomalies may result from missing data in the main meter, incorrect readings in the sub-meters, or overlapping measurements across sub-meters in buildings with several sub-meters. Users are advised to use caution when analysing the buildings and meter readings where this occurs.
Collection of contextual building data
The contextual data of each building connected in Energinet was collected and reported by Drammen Municipality in 2018 in an internal report. The report was created for internal use in Drammen Municipality and describes the size, location and use of every building, as well as their heating and ventilation systems and control system. The information of this report was used and extracted to fill into a standardized format of contextual data for each building file. In addition, information about the buildings were extracted from the energy labels of the buildings. The energy labelling of buildings is mandated by law for all public buildings larger than 250 m2 of heated floor area13. The law sets requirements for the competence of professionals who label buildings, but as an energy label is valid for 10 years, there may have been changes in the building information not mentioned in the energy labels. As a control, during the data collection in 2022, the building contextual information from the various sources was reviewed and updated through discussions with Drammen Municipality.
Practical applications of the dataset
The dataset, either used as a whole or parts of it, have potential for several applications, including:
Load profile analysis
The dataset includes electricity main meter readings (AMS) for nearly four full years across all buildings, making it possible to create and analyse load profiles for the buildings and building categories. These profiles show how different building categories, heating technologies, and construction years affect annual and daily energy consumption patterns, and how they are affected by the outdoor temperature and seasonality. By examining these load profiles, we can better understand how energy use varies by building type and season. Load profiles for different building categories can be useful for grid and area planning and provide insights into peak load times, which can aid in better forecasting and planning for energy needs.
Sub-meter analysis
Some of the building files include sub-metered data for various energy purposes and appliances. This data provides valuable insights into how different energy uses contribute to the peak loads of buildings and helps assess the demand response flexibility of individual loads.
Load disaggregation training
Load disaggregation, also known as non-intrusive load monitoring (NILM), is the process of breaking down a building’s total electricity consumption into its component loads, such as individual appliances or energy purposes. It is a cost-effective alternative to installing sub-meters in buildings, where the electricity for different components are estimated from a single point of measurement, eg. the electricity main meter. Load disaggregation typically relies on data-driven methods which require training data from buildings with sub-meters. This dataset contain energy use measurements for several sub-meters, including 14 buildings with separate meters for electric boiler (ElBoil), but also several other sub-meters from different buildings.
Classification training
Classification training involves using energy use data alongside contextual building information to train models that estimate specific characteristics of a building. For instance, this dataset has been used, together with additional building and weather data, to train models capable of predicting building category and heating type based solely on energy time series data16. The dataset can be used for training classification models to infer other contextual building attributes as well.