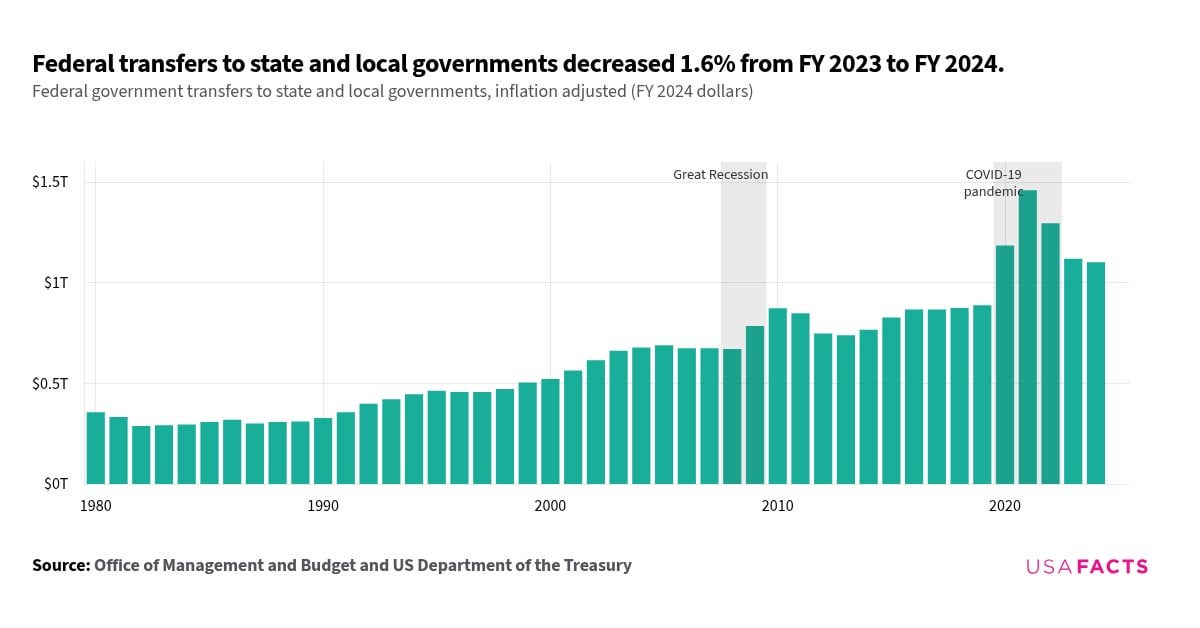
In FY 2024 (the federal fiscal year runs October 1 to September 30), the federal government transferred $1.1 trillion to state, local, and tribal governments, accounting for 16.2% of all federal spending. This support helps fund things like infrastructure, education, and healthcare for low-income individuals through programs like Medicaid and the Children’s Health Insurance Program (CHIP). Of the total transfers, 53% were for Medicaid and CHIP.
Although federal transfers to state and local governments increased steadily over the past decade — rising 43.7% (inflation-adjusted) since FY 2014 — there was a 1.6% decrease between FY 2023 and FY 2024. This slight drop follows a period of federal support related to pandemic response and recovery, including legislation like the American Rescue Plan of 2021. Even with the recent decrease, the current level of federal assistance remains higher than it was before the pandemic.
In terms of local impact, federal funding as a share of state and local government revenues varies widely, from 19.3% in North Dakota to 39.3% in Alaska (based on FY 2022 data).
3 comments
Sources: Office of Management and Budget, US Department of the Treasury, Census Bureau
Tools: Custom
You can use this tool to see data on your state, but the geo-picker is a bit hard to use. The good news is that we’re working on a new one. The bad news is that it’s not on this page yet. Here’s [South Dakota](https://usafacts.org/answers/how-much-money-does-the-federal-government-provide-state-and-local-governments/state/south-dakota/).
In FY 2024 (the federal fiscal year runs October 1 to September 30), the federal government transferred $1.1 trillion to state, local, and tribal governments, accounting for 16.2% of all federal spending. This support helps fund things like infrastructure, education, and healthcare for low-income individuals through programs like Medicaid and the Children’s Health Insurance Program (CHIP). Of the total transfers, 53% were for Medicaid and CHIP.
Although federal transfers to state and local governments increased steadily over the past decade — rising 43.7% (inflation-adjusted) since FY 2014 — there was a 1.6% decrease between FY 2023 and FY 2024. This slight drop follows a period of federal support related to pandemic response and recovery, including legislation like the American Rescue Plan of 2021. Even with the recent decrease, the current level of federal assistance remains higher than it was before the pandemic.
In terms of local impact, federal funding as a share of state and local government revenues varies widely, from 19.3% in North Dakota to 39.3% in Alaska (based on FY 2022 data).
You can use this tool to see data specific to your state (or any state, really). Here’s one: [Massachusetts](https://usafacts.org/answers/how-much-money-does-the-federal-government-provide-state-and-local-governments/state/massachusetts/).
I’d be interested in seeing state per capita transfers as well as a % of state gdp to go along with state budget
Comments are closed.