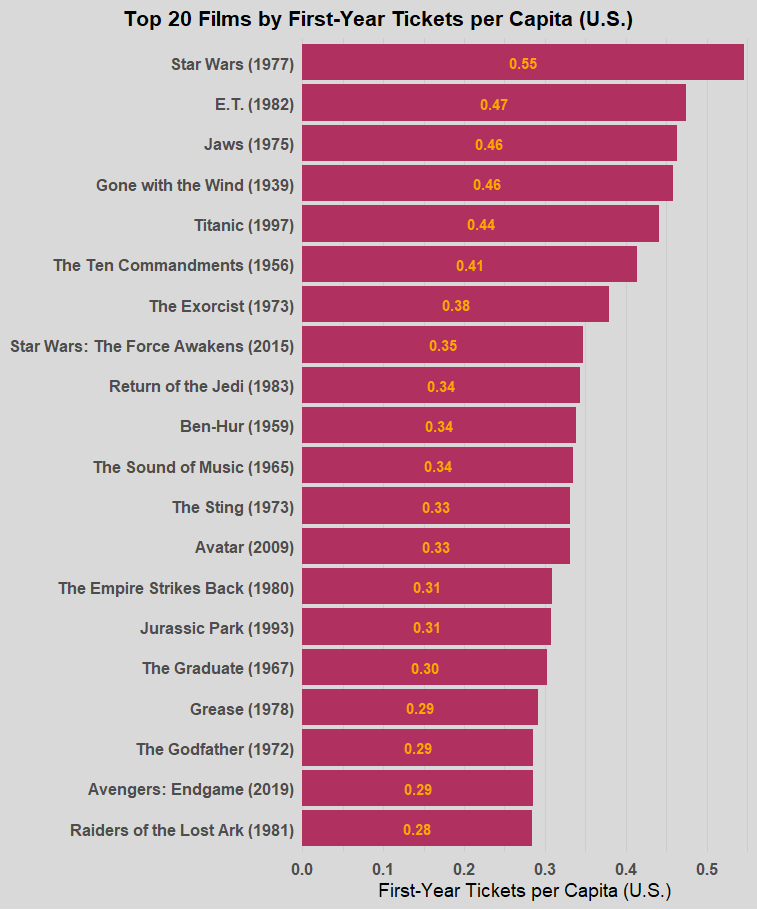
First year sales for old movies like gone with the wind were not directly available so estimating was used. Ticket sale sources (box office mojo, the numbers, variety, Wikipedia, others) often appeared to use gross earnings divided by average ticket prices. Used mid year census data for populations.
Used Rstudio for the graph
I never appreciated graphs for total gross, or even ones adjusted for inflation. Felt there was better ways to do it. I always thought tickets per capita was better but old movies were always over represented it seemed. A lot of that is because they had really long run times and re runs. So here is ticket sales per capita but just for the first 12 months of release.
Reposted cause some of the data was missing.
I liked that you put per capita. It’s an interesting visualization!
For improvement, orange text over red background (bar chart) is hard to read and hurts eyes.
There should be contrast between text color and background color.
Lucas and Spielberg raking it in 🙂
This is based on US sales and US population?
I saw most of those in the theater first run. Not Ben hur or gone with the wind though. Pretty good list of classics.
One factor the influences this is that modern movies have a much shorter theater run, so a lot more people end up watching the films on streaming services a few weeks or months later, whereas in the past there would still be people buying theatre tickets many months after release.
This is a really good way of seeing which movies were hits in the U.S. Arguably more elegant than adjusting for inflation, and avoids messiness from rereleases.
7 comments
First year sales for old movies like gone with the wind were not directly available so estimating was used. Ticket sale sources (box office mojo, the numbers, variety, Wikipedia, others) often appeared to use gross earnings divided by average ticket prices. Used mid year census data for populations.
Used Rstudio for the graph
I never appreciated graphs for total gross, or even ones adjusted for inflation. Felt there was better ways to do it. I always thought tickets per capita was better but old movies were always over represented it seemed. A lot of that is because they had really long run times and re runs. So here is ticket sales per capita but just for the first 12 months of release.
Reposted cause some of the data was missing.
I liked that you put per capita. It’s an interesting visualization!
For improvement, orange text over red background (bar chart) is hard to read and hurts eyes.
There should be contrast between text color and background color.
Lucas and Spielberg raking it in 🙂
This is based on US sales and US population?
I saw most of those in the theater first run. Not Ben hur or gone with the wind though. Pretty good list of classics.
One factor the influences this is that modern movies have a much shorter theater run, so a lot more people end up watching the films on streaming services a few weeks or months later, whereas in the past there would still be people buying theatre tickets many months after release.
This is a really good way of seeing which movies were hits in the U.S. Arguably more elegant than adjusting for inflation, and avoids messiness from rereleases.
Comments are closed.