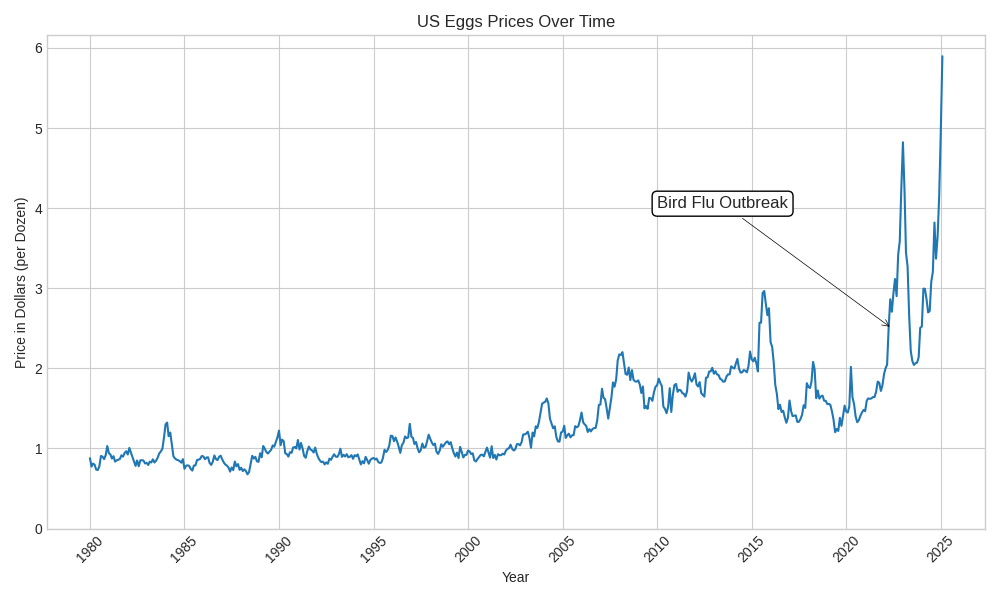
Data from [https://fred.stlouisfed.org/series/APU0000708111](https://fred.stlouisfed.org/series/APU0000708111) released on the 12th of the month for the previous month. Lots of people asked me to update this with new data as the prices seemed to keep rising.
Weird how that always happens around times of political unrest
You mean to tell me it was the bird flu that caused egg prices to go up and not Biden? /s
I was just reading they were falling
That graph is current only through Dec 2024. Where are prices today?
The current shit is fucked on all levels, but it looks like the fuckery initially began around 2002 – 2003.
What happened around that time to make egg pricing start pretending it was the it was the goddamn Nasdaq?
Can you add egg production overlaid on this graph? I’ve been hearing reports that production has not decreased as much as they had predicted.
Can you add egg production overlaid on this graph? I’ve been hearing reports that production has not decreased as much as they had predicted.
Could you make it inflation adjusted?
Found it interesting that at my local grocery store, 18 quail eggs were cheaper than 12 chicken eggs.
You can see in daily commodity trading data that egg prices have peaked this month and are now rapidly dropping as production finally catches up. It will take at least a month for USDA data to catch up since it’s a lagging indicator.
14 comments
Data from [https://fred.stlouisfed.org/series/APU0000708111](https://fred.stlouisfed.org/series/APU0000708111) released on the 12th of the month for the previous month. Lots of people asked me to update this with new data as the prices seemed to keep rising.
Python code here [https://colab.research.google.com/drive/1PQi8x8WUJ18dRnJ0sKXqiwmxaqSCmMK7?usp=sharing](https://colab.research.google.com/drive/1PQi8x8WUJ18dRnJ0sKXqiwmxaqSCmMK7?usp=sharing)
Weird how that always happens around times of political unrest
You mean to tell me it was the bird flu that caused egg prices to go up and not Biden? /s
I was just reading they were falling
That graph is current only through Dec 2024. Where are prices today?
The current shit is fucked on all levels, but it looks like the fuckery initially began around 2002 – 2003.
What happened around that time to make egg pricing start pretending it was the it was the goddamn Nasdaq?
Can you add egg production overlaid on this graph? I’ve been hearing reports that production has not decreased as much as they had predicted.
Can you add egg production overlaid on this graph? I’ve been hearing reports that production has not decreased as much as they had predicted.
Could you make it inflation adjusted?
Found it interesting that at my local grocery store, 18 quail eggs were cheaper than 12 chicken eggs.
You can see in daily commodity trading data that egg prices have peaked this month and are now rapidly dropping as production finally catches up. It will take at least a month for USDA data to catch up since it’s a lagging indicator.
https://preview.redd.it/fklt1f5gz9oe1.jpeg?width=1080&format=pjpg&auto=webp&s=d7d9b0b20b8545afacd7f8038687350f7d27609a
[Source](https://tradingeconomics.com/commodity/eggs-us)
can you get this adjusted for inflation?
https://preview.redd.it/vt4rfhxwtaoe1.jpeg?width=1284&format=pjpg&auto=webp&s=ae9bb17acbe3e0735baa9c9312efce0278c8f26c
Stop using old graphs to fuel you’re propaganda 🤡
Someone can explain the new direction the price took in like 2002? Farms failing in the economic crash and then private equity buying up everything?
Comments are closed.