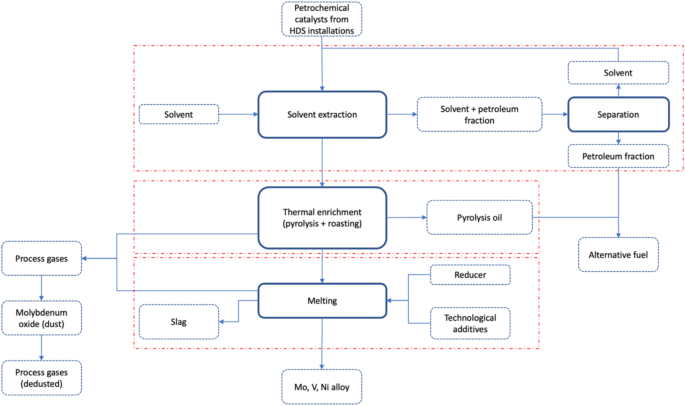
The materials for the study were spent, end-of-life petrochemical catalysts from hydrodesulphurisation units with the composition presented in Table 1.
The catalysts came from the gudron hydrodesulphurisation plant (HOG), where vacuum residues from crude oil distillation are processed. The spent, end-of-life petrochemical catalysts granulation was examined nad showed that the catalysts have the 0.5 ÷ 4 mm grain fraction, consisting of irregularly shaped grains from 0.5 to 3 mm and cylinders 1 mm in diameter and 2 ÷ 3 mm in length. The plant consists of two reactors with a so-called embers bed, where gudron containing 3.3% sulphur, 0.65% nitrogen and approximately 215ppm nickel and vanadium is processed6.
A further stage was to determine in the form of which compounds the elements were present in the material. For this purpose, the catalysts were subjected to X-ray phase analysis.
A qualitative analysis of the phase composition of the samples was performed based on the interpretation of the diffractogram prepared with a Seifert-FPM XRD7 X-ray diffractometer with Seifert software i Match! and ICDD PDF-4 + catalogue data 2023. X-ray characteristic radiation Cu Kα and a Ni filter were used. The analysis was carried out in the 2θ angle range from 10° to 100°. The resulting X-ray diffractometer phase analysis of the test sample is shown in Fig. 2.

X-ray diffractogram obtained from a sample of spent petrochemical catalyst showing the forms in which each metal occurs (spent petrochemical catalyst; Al(PO4); V3S4; Al2.67O4; Ni3S2; SiO2).
The diffractogram obtained indicates the presence in spent petrochemical catalysts of phases such as nickel sulphide Ni3S2 in the form of heazlewoodite (which has a melting point of 797 °C8), vanadium sulphide V3S4 (which has a decomposition temperature above 750 °C9,10,11), Al2.67O4, which is a gamma variant of aluminium (III) oxide γ-Al2O3, aluminium phosphate Al(PO4) as berlinint (which has a melting point of about 1800 °C and a decomposition temperature of about 1220 °C12,13) and silica SiO2 in the form of cristobalite.
In additional, X-ray microanalysis examinations were carried out using an X-ray microanalysis probe on a catalyst sample in the form of a powder applied to a double-sided adhesive carbon slice and by sticking it onto a measuring table. The sample prepared in this way was subjected to tests using a JEOL JXA 8230 X-ray microanalysis probe (15 kV accelerating voltage applied), for which:
electron imFig. (Fig. 3) in secondary electron light (SEI) and in back-scattered electron light (BSE COMPO),
elemental distribution maps using the energy dispersive method (EDS),
quality (energy spectra, EDS) and quantitative analyses of chemical composition (EDS) using standards of all analysed elements for selected areas and points on the sample surface.
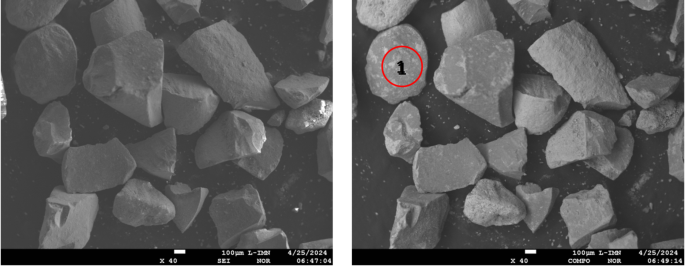
Electron images of petrochemical catalysts taken in SEI mode (contrast depends mainly on surface topography).
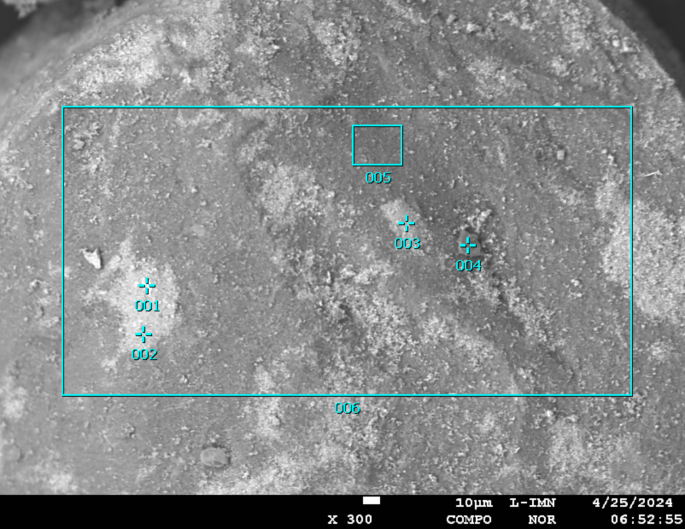
Electron image of the catalyst powder from area 1 of Fig. 3, taken in COMPO mode (reveals differences in chemical composition, the lighter colour corresponding to the heavier element).
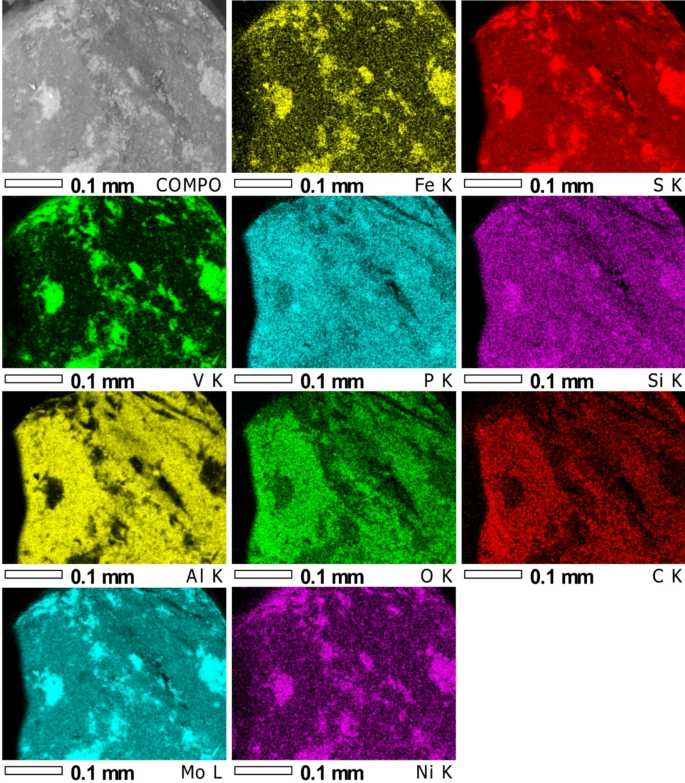
Elemental distribution maps for the surface from the COMPO photo (first left; Fig. 4).
The analyses and element distribution maps performed reveal differences in chemical composition (the lighter colour corresponds to the heavier element). The measurements show that the material has phases consisting of: V + S, Al + O with possible addition of P and S, Si + Mg and S + V + Fe + Ni + Mo.
The point analyses carried out (points from Fig. 4) showed high sulphur and vanadium content, as well as iron, nickel and molybdenum. In contrast, analysis from the surface of two areas showed mainly oxygen, aluminium and sulphur (Table 2). The elemental distribution maps (Fig. 5) confirm this. It can also be seen from the distribution maps that silica and phosphorus are almost homogeneously distributed over the entire area analysed, while aluminium, oxygen and carbon were identified mainly in the dark area of the sample. Analysis of the bright area (Fig. 4) confirms the high concentration of sulphur and vanadium with nickel and iron in these areas.
As part of the study to determine the physical and chemical properties of spent petrochemical catalysts, thermogravimetric studies were also carried out, the results of which are presented in Fig. 6 (in an oxidising atmosphere) and Fig. 7 (in an inert atmosphere, argon).
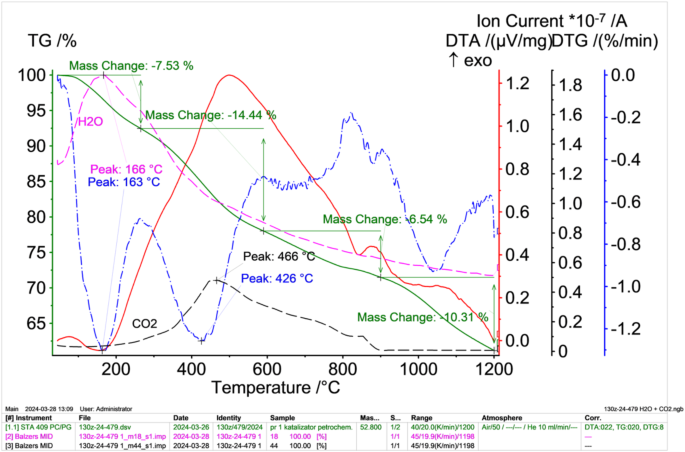
TG (green solid lines), DTA (red solid lines) i DTG (blue dashed dotted line) results of petrochemical catalysts in an oxidising atmosphere after solvent extraction with correlated water (pink dashed dotted lines) and carbon (VI) oxide (VI) (black dashed dotted lines) release intensities obtained from the mass spectrometer.
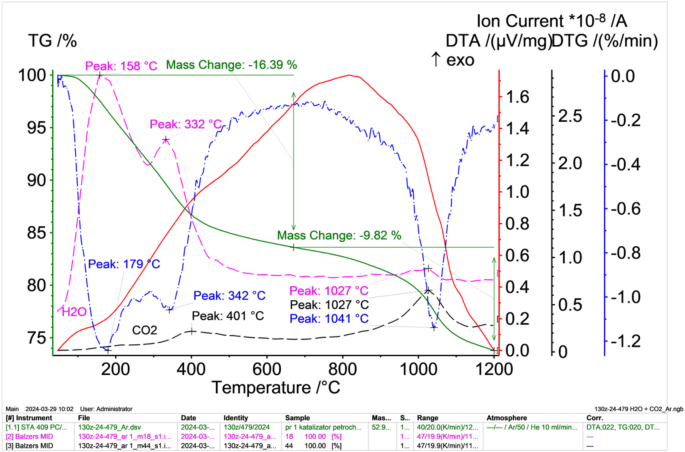
TG (green solid lines), DTA (red solid lines) i DTG (blue dashed dotted lines) results of petrochemical catalysts in an inert atmosphere after solvent extraction with correlated water (pink dashed dotted lines) and carbon monoxide (VI) release intensities (black dashed dotted lines) obtained from the mass spectrometer.
The results obtained from the thermal differential analysis performed in an oxidising atmosphere (Fig. 6) show that, as the sample is heated, there is a decrease in mass, which is initially related to the evaporation of moisture and then to the oxidation (burning) of the petroleum fraction (hydrocarbons) remaining in the catalysts after the solvent extraction process (moisture and the petroleum fraction contained in the capillary pores impossible to remove by drying and solvent extraction). The DTA curve shows an exothermic peak at around 500 °C. This peak may be related to oxidation (combustion) reactions of the petroleum fraction that is released during sample heating. This is evidenced by an increase in the concentration of CO2 in the gases, the maximum of which is reached at 466 °C. In this temperature range, a rapid decrease in the mass of the sample is also observed (DTG curve), the maximum of which is reached at 426 °C.
A significant sample weight loss of 14.4% occurs in the temperature range 280–600 °C, which may be related to the significant burning of the petroleum components and the release of sulphur in the form of SO2 (the decomposition temperature of vanadium sulphide V3S4 is 750 °C and that of nickel sulphide Ni3S2 is 787 °C). The total mass loss at 1200 °C was 20,649 mg, representing 38.82% of the initial sample mass.
In contrast, the results of thermal differential analysis taken under inert conditions (Fig. 7), show a lower sample weight loss of 26.21%. This is most likely due to slower evaporation of moisture as well as evaporation of volatile components in the form of hydrocarbons and the release of sulphur. The observed exothermic peak in the DTA curve reaches a maximum at about 830 °C (shifted from about 500 °C compared to measurements in an oxidising atmosphere). Carbon monoxide (IV) evolution observed, which has two maxima between 200 ÷ 450 °C, the other above 1100 °C.