Spatial variations in environmental conditions were examined between the inner and outer sites of MC. Salinity exhibited a notable disparity, with inner site B1 displaying significantly lower values (25.7±11.3) and a larger standard deviation compared to the outer sites (31.7±1.4) (t = 8.7, p 1). Dissolved oxygen (DO) and pH levels were notably elevated at the inner site (DO: 17.4±2.8 mg L−1; pH: 8.3±0.3) in contrast to the outer sites (DO: 13.6±1.2 mg L−1; pH: 8.0±0.1) (DO: t = −7.3, pt = −7.8, p1). Moreover, subtidal phytoplankton biomass (Chl-a) was significantly higher in the inner site (0.004±0.005 μg−1) than the outer sites (0.002±0.001 μg−1) (F = 27.8, p1). The lower salinity (with a large standard deviation) and higher DO and pH in B1 indicated meltwater intrusion along with unique dynamics of fjord and glacier interactions near the glacier edge in MC19. The elevated phytoplankton production observed in B1 may be attributed to iron (Fe) input from glaciers, as suggested by previous studies20,21,22. Phytoplankton and ice algae have been identified as primary food sources for consumers along the Antarctic coast20,23. However, phytoplanktonic production in MC generally appeared lower compared to other Antarctic coastal areas24. Therefore, benthic microalgae and macroalgae likely serve as essential food sources for benthic organisms in MC25,26.

A Map of the study area showing the six intertidal sites (inner, B1; outer, W1 and B2–B5) and five subtidal sites (MC1–MC5), including three sites reported in a previous study described with white square27 with past glacier retreat records since 1956 in Marian Cove, King George Island, Antarctic Peninsula. Top-down images of five sites illustrate the approximate glacier influences as a function of distance (km) from the glacier. The distances are indicated on the images using bold italicized black text with a yellow background for clarity. B Variables (salinity, DO and pH) reflect contrasting environmental conditions between the inner and outer intertidal sites during the present study period (2018–2019). The black and blue lines and shading in the graph represent the mean and standard deviation values observed at the inner and outer sites, respectively. The base map was obtained from Google Earth (https://earth.google.com/web).
Food web structure in Marian Cove, King George Island
Four diets (particulate organic matters, POM; microphytobenthos, MPB; red-, and brown macroalgae) and eight consumers were collected in MC (Fig. 2A and Supplementary Table 1). ANOVA with the post hoc Tukey test revealed significant differences in the carbon and nitrogen stable isotope values among food sources (POM, MPB, and macroalgae) (δ13C: F = 22.0, pδ15N: F = 25.4, pδ13C values (−14.6±3.5‰) compared to MPB (−21.2±3.5‰) and POM (−21.8±3.1‰). In contrast, for δ15N, macroalgae displayed the distinctly lowest value (2.6±1.4‰) compared to MPB (6.6±1.2‰) and POM (6.0±2.4‰).

A Stable isotopic ranges of potential food sources (particulate organic matter, POM; microphytobenthos, MPB; red and brown macroalgae) are represented by empty blue, green, pink, and brown boxes. Consumers, presented as gray symbols indicate five taxonomic groups (triangle, Mollusca; circle, Arthropoda; square, Chordata; diamond, Cnidaria; star shape, Echinodermata) with total means and standard deviations. Consumers marked with an asterisk and highlighted in bold yellow present species collected from both the inner and outer sites in the MC. The trophic level ranges (min.–max.) for eight consumers (a total of 3 TLs: from 1.7 for N. concinna to 4.2 for N. coriiceps) are presented using red pyramid shape next to the biplot. B Spatial mean stable isotope values of three diets and consumers. Diets and consumers showing significant mean differences in stable isotope values between inner and outer sites are indicated with red means (line) and standard deviations (shade), along with the significant p-value.
The δ13C variability observed in marine primary producers was largely attributed to varying rates of CO2 uptake from the surrounding environment27,28. Consequently, the uptake of atmospheric CO2 likely contributed to the depleted δ13C values observed in phytoplankton and intertidal microalgae29,30. In contrast, the enriched δ13C values of macroalgae reflected 13C-enriched CO2 utilization in the seawater, and their active photosynthesis31. The variability in δ15N among primary producers suggested that they were influenced by different sources of inorganic nitrogen in their habitats9,32.
The Kruskal-Wallis test followed by Dunn’s post hoc comparisons identified significant variation in carbon and nitrogen stable isotope values across the eight consumer species examined (δ13C: H = 51.2, pδ15N: H = 53.6, p2A and Supplementary Table 1). The Antarctic limpet N. concinna, exhibiting the most enriched δ13C values (−14.6±1.5‰), was found to differ significantly from four other taxa. In contrast, Antarctic krill, with the most depleted δ13C values (−23.4±0.3‰), showed significant differences compared to two δ13C-enriched organisms, N. concinna and Tigriopus kingsejongensis. For δ15N, both N. concinna and Antarctic krill, with lower δ15N values (5.5±0.7‰ and 5.6±0.3‰, respectively), differed significantly from two fish species and the copepod T. kingsejongensis.
In addition, the highest and lowest δ15N values were recorded for the Antarctic cod Notothenia coriiceps (10.4±0.1‰), and the limpet (5.6±0.8‰), respectively. The progressive increase in δ15N among consumers, from grazer limpets to carnivorous fish, suggested the presence of approximately three trophic levels (TL) within the MC food web (Fig. 2A).
Antarctic krill take up various diets such as ice algae, phytoplankton (diatoms, flagellates), zooplankton (copepods), detritus, etc33. Previous study reported enriched δ13C values of krill fed on ice algae34. However, in the present study, krill (Euphausiacea sp.) the most depleted δ13C values, indicating that krill utilized more POM and phytoplankton in the MC14 (Fig. 2A and Supplementary Table 1). The two herbivores (limpets and krill) had contrasting δ13C values, indicating they utilize different baseline sources in benthic and pelagic systems. The depleted δ¹⁵N values and low TL observed in the omnivore Gondogeneia antarctica and the carnivore Haliclystus antarcticus suggest a reliance on primary producers or prey at a lower TL, indicating a shift in their dietary sources. This shift reflects their trophic plasticity, such as adjusting feeding behavior or trophic position, to adapt to the changing availability of food resources caused by glacier retreat7,15. The enriched mean δ¹⁵N value with a wider distribution in T. kingsejongensis reflects the detritivorous feeding strategy of the harpacticoids, genus Tigriopus35,36. However, for a better understanding, we suggest examining the feeding strategy of T. kingsejongensis in a future study.
Spatial stable isotopic distribution of producers and consumers in Marian Cove, King George Island
All diets exhibited significant 13C enrichment in B1 (POM: t = 7.1, pt = 9.1, pt = 5.2, p2B and Supplementary Table 1). This change in δ13C of diets (POM, microalgae, and macroalgae) at the inner site (B1) resulted in significant δ13C enrichment in three commonly occurring consumers (N. concinna: t = 2.7, pG. antarctica: t = 11.3, pT. kingsejongensis: t = 2.4, p2B and Supplementary Table 1)37. The observed δ13C enrichment of producers and consumers at the inner site aligns with findings from the previous studies9,14.
The δ13C enrichment of producers might be attributed to increased utilization of HCO3- and the generation of organic materials within the confined environment beneath glaciers9. It was anticipated that this enriched δ13C values would propagate from producers to consumers along the TL in B138. Size-related adaptability to changes in the source and trophic fractionation of consumers might also influence spatial differences in stable carbon isotopes in MC (Fig. 3 and Supplementary Fig. 2). No spatial differences were detected in δ15N across all food sources. However, the copepod T. kingsejongensis exhibited significant spatial variations in δ15N (t = 8.9, p
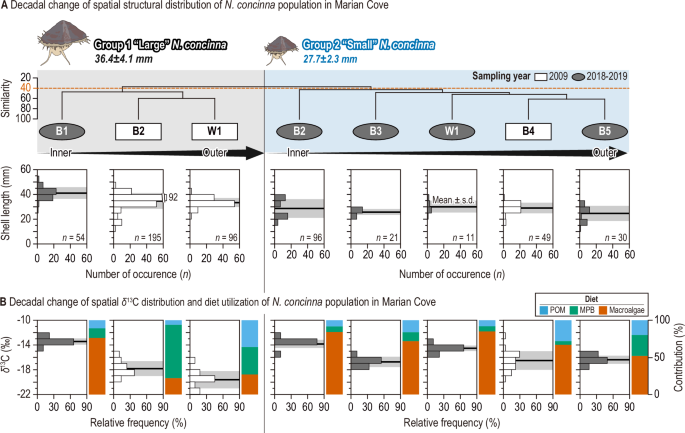
A Small and large limpet groups (Groups 1 and 2) identified by cluster analysis based on shell length (mm) at a (dis)similarity level of 40. White rectangles and gray ellipses indicate limpet samples collected in 200927 and 2018–2019, respectively. Limpet samples in each group are arranged by distance from the glacier, as indicated by black arrows (inner to outer sites). The black line with a gray shade represents the mean and standard deviation of the shell length distribution for each limpet sample. B The spatial distribution of the stable carbon isotope signature (δ¹³C, Y-axis on the left) of eight limpet samples, along with the contributions (%; Y-axis on the right) of three food sources, as indicated by colors (blue: particulate organic matter [POM]; green: microalgae; red: macroalgae).
Decadal changes in the structure and function of the Antarctic limpet in Marian Cove, King George Island
Cluster analysis was conducted to estimate decadal alterations in the spatial distribution of the limpet population in the MC. This analysis identified two primary groups (Group 1 and Group 2) among N. concinna samples based on shell length at a (dis)similarity level of 40 (Fig. 3A). Group 1 comprised large limpets (mean, 36.4±4.1 mm) predominantly found in B2 and W1 during 2009, and in B1 during 2018–2019. In contrast, Group 2 consisted of small limpets (mean, 27.7±2.3 mm) primarily collected from outer sites across both time periods (Fig. 3A). Larger limpets exhibited greater migration activity to recently established ice-free habitats compared to smaller limpets, indicating size-dependent adaptability and intraspecific competition for niche expansion in source-limited intertidal rocky shores39,40,41. Both groups of limpets exhibited significant δ13C enrichment over a narrower range in 2018–2019 compared to that estimated in 2009 (Group 1, t = −21.1, pt = 6.3, p3B and Supplementary Table 2). Thus, limpets in 2018–2019 consumed a more 13C-enriched diet (including macroalgae) intensively compared to those collected in 2009. The decadal increase in the macroalgal contribution to limpets supports this finding (Fig. 3B).
Previous studies have documented the reliance of numerous benthic organisms inhabiting the coastal regions of King George Island on benthic microalgae and macroalgae in environments characterized by low phytoplankton biomass24,42. Our assessment indicates a substantial benthic contribution to limpets, particularly in settings with minimal subtidal pelagic production, corroborating earlier findings in the previous studies in the MC (Fig. 3B and Supplementary Fig. 1). The dietary changes over decades were more pronounced in the larger limpet group residing near the glacier edge compared to the smaller group inhabiting outer sites (Fig. 3B and Supplementary Table 2). The gradual increase in macroalgae dependence among large limpets at B1, approaching levels similar to those of small limpets in outer sites, reflects the simplified trophic functions in the coastal ecosystem of the MC. This diet shift of Antarctic limpets is attributed to a substantial rise in macroalgal biomass in the MC, driven by increased retreating glaciers and nutrient input to their habitats26,43,44. Given the pivotal role of macroalgae, with over 73% contribution to limpets in the late 2010s in MC (Fig. 3B), their potential decline in the future due to extreme temperatures exceeding their survival threshold could have direct or indirect implications for the function and stability of the MC food web structure45,46. In the context of a future climatic crisis, the potential loss of macroalgae due to extreme temperatures exceeding their critical survial thresholds could trigger a cascade of secondary extinctions through the MC food web, which is heavily reliant on macroalgae as its simplified basal resource. Rocky shore species have been identified as cost-effective sentinels responding to global climatic change in long-term previous studies47,48. In particular, space-occupying key organisms such as gastropod grazers are well known as useful study taxa for predictive modeling of ecological processes that generate spatial and temporal changes in abundance47. In this study, we propose that the carbon and nitrogen stable isotope values of limpets can serve as effective indicators of climatic changes in nearshore ecosystems.
Influence of multi-decadal changes to sea ice extent on spatial variations of stable isotopes among producers and consumers in Antarctica
Significantly negative and positive correlations between year and summer sea ice extent were obtained for West (Bellingshausen and Amundsen Sea: r = −0.42, pr = 0.44, p4A). Variations in sea ice extent in Antarctica are driven by a combination of multiple atmospheric and oceanic factors8,49,50. In Antarctic coastal ecosystems, the dynamics of food web are inherently linked to the sea ice conditions, which affect the availability of primary food sources for consumers51. Therefore, we hypothesized that the divergent changes in sea ice extent between West and East Antarctica may influence food web dynamics in both regions through distinct processes.

A Regional summer sea ice extent variation (2000–2018)8 in the Bellingshausen and Amundsen Seas (left) and the Western Pacific Ocean (right), along with locations where reference stable isotope data were collected sampling sites include the following regions in Antarctica: West – (1) South Shetland Islands and (2) Ross Sea; East – (3) Adélie Land, (4) Windmill Island, (5) Wilkes Land, (6) Davis Sea, and (7) Prydz Bay. B Multi-decadal changes in carbon and nitrogen stable isotopes (Δδ¹³C and Δδ¹⁵N) of classified taxonomic groups with five feeding strategies: Gr (grazer), Ff (filter feeder), Df (deposit feeder), Om (omnivore), Sc (scavenger), and Ca (carnivore). These changes are compared between the West (left, downward red triangle) and East (right, upward blue triangle), reflecting contrasting sea ice retreat and advance. Mean multi-decadal stable isotopic changes of consumers are represented with orange and blue backgrounds, with arrows indicating trends on the graph. Specific data from previous studies are provided in Supplementary Table 3, and all species included in the functional taxonomic groups in the graph are listed in Supplementary Table 4. The base map in Fig. 4A was obtained from the NASA Earth Observatory (https://earthobservatory.nasa.gov/world-of-change/sea-ice-antarctic/show-all).
Significant changes in δ13C were observed for marine organisms during the 2010s, a period marked by rapid changes in Antarctic ice extent (Fig. 4B and Supplementary Table 3). In West Antarctica, marine organisms displayed significant mean δ13C enrichment, reaching 2.6‰ in the 2010s (F = 6.7, pδ13C signatures, approximately 3.2‰ following conversion (F = 4.3, pδ13C of consumers suggested distinct dietary shifts in consumers exposed to different multi-decadal changes to sea ice extent in West and East Antarctica.
The shift in the mean contribution of producers (pelagic phytoplankton, sympagic ice algae, benthic micro- and macroalgae) to organisms in West and East Antarctica corresponded to the contrasting changes observed in consumer δ13C values (Fig. 5). In West Antarctica, where sea ice is retreating, the mean contribution of both sympagic and benthic producers to consumers increased by over 50% during the 2010s (Fig. 5A). However, the mean utilization of pelagic sources by consumers in West Antarctica decreased by 40%. Notably, all consumer groups exhibited greater reliance on benthic sources in the late 2010s. The heightened utilization of benthic sources by consumers closely reflected the substantial increase in benthic production, driven by increased light availability following the reduction in sea ice in West Antarctica52. A previous study reported an increase in phytoplankton contribution to coastal consumers in the marginal ice zone, attributed to heightened phytoplankton biomass in coastal areas experiencing sea ice loss1. However, our findings revealed a decrease in pelagic phytoplankton contribution to consumers along the West Antarctic coast, coinciding with marked declines in ice extent. This result indicated a comparatively modest rise in pelagic production relative to benthic production in West Antarctica, influencing reduced phytoplankton utilization by consumers during the 2010s. This trend may also be linked to the predominant sampling locations, primarily concentrated in the Bellingshausen-Amundsen Sea region, characterized by lower concentrations of phytoplanktonic biomass53.

Multi-decadal changes in contribution (%) of three types of diets (P, pelagic; S, sympagic; B, benthic) to the consumers in (A) West Antarctica with substantial sea ice retreat (left) and (B) in East Antarctica with substantial sea ice advance (right). The feeding strategies of consumers are described with abbreviations (grazer, Gr; filter feeder, Ff; deposit feeder, Df; omnivore, Om; scavenger, Sc; carnivore, Ca) in blue superscript. Trophic levels are described with colors (TL1, blue; TL2, green; TL3, yellow-orange; TL4, deep orange). Squares with red and blue gradations indicate an increase and decrease in diet contribution (%) of three producers to consumers, from 0 to 100%, respectively.
During the 2010s, organisms in East Antarctica displayed a heightened reliance on pelagic phytoplankton, indicative of the relatively elevated production of phytoplankton under advancing sea ice conditions in the region (Fig. 5B)28. This outcome can be attributed to the scarcity of micro- and macrophytes on the seafloor, constrained by the limited light penetration beneath the sea ice throughout much of the year54. Long-term fluctuations in δ13C levels in coastal organisms may also be influenced by the divergent intrusion of atmospheric 13C-depleted signatures along the West and East Antarctic coasts, originating from fossil fuel combustion55. A previous study noted a decline in δ13C levels in globally distributed fish due to the incorporation of fossil fuel-derived isotopically light carbon into the marine ecosystem55. Therefore, we propose that the δ13C depletion observed in East Antarctic organisms could be additionally influenced by atmospheric depletion of δ13C due to reduced meltwater intrusion. However, this effect appeared to be negligible in West Antarctic marine organisms inhabiting environments subject to complex environmental influences from various factors (e.g., meltwater interference), substantially increasing primary production of benthic organisms (MPB and macroalgae) which have enriched 13C values. Further investigations are warranted to precisely elucidate the underlying mechanisms driving this phenomenon. Among the 22 taxonomic and functional groups examined, multi-functional consumers exhibited the greatest overall changes in Δδ13C along both the West and East Antarctic coasts (Fig. 4B).
The carnivorous gastropoda exhibited the highest total Δδ13C variation on both the West and East coasts, followed by the deposit-feeding ostracoda, which is exposed to various diets (e.g., dead and living microalgae, macroalgae, and organic detritus from various origins) in the benthic environment (Supplementary Table 3). The δ13C range of consumers reflected their capacity to adjust to variations in producer availability. Consequently, the substantial fluctuations in δ13C observed in multi-functional consumers suggest a high degree of trophic plasticity, an adaptive characteristic encountered in Antarctic environments undergoing considerable changes15. However, the relatively minor Δ δ13C observed in consumers primarily exhibiting a single feeding strategy reflects specific dietary preferences, potentially jeopardizing their persistence in the rapidly evolving Antarctic environment. Notably, there was no discernible change in the δ15N values of marine organisms in both regions (Fig. 4B), suggesting that alterations in sea ice extent have predominantly influenced the trophic niche rather than the trophic position of Antarctic coastal organisms.