We propose a Climate-induced Renewable Energy System Cascading Event (CRESCENT) model. This model bridges the dynamics of renewable energy systems with evolving extreme weather events by integrating a spatiotemporal hazard model, a renewable energy system vulnerability model, and a multi-scale spatiotemporal cascading power outage model (see Fig. 1 and Methods). The meteorological component exemplifies tropical cyclones as a typical climate extreme to the Puerto Rico energy system and employs a physics-based tropical cyclone wind field model to generate high-resolution spatiotemporal wind hazards. The renewable energy system vulnerability model is used to simulate the effects of climate extremes on spatiotemporal infrastructure damage and renewable generation reduction. We assess the spatiotemporal infrastructure damage to both transmission and distribution networks through hazard resistance risk analysis (see Methods). The damage to distribution feeders within distribution networks results in the spatiotemporal loss of demand at the transmission network level, affecting grid operations. We consider the shutdown of wind turbines under extreme wind conditions and evaluate the climatic sensitivity of solar PV generation. This evaluation includes the analysis of generation decline in both utility-scale and distributed rooftop solar PV systems, attributed to wind-induced panel damage and reduced solar irradiance due to extensive cumulonimbus clouds.
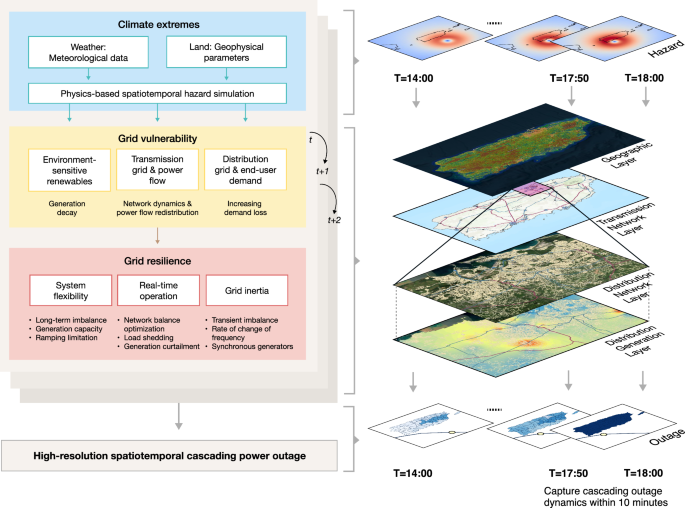
The proposed CRESCENT model enables the high-resolution spatiotemporal analysis of the climate extreme effect on comprehensive energy systems and captures the cascading outage dynamics. The visualized data of the geographic, transmission network, distribution network, and distribution generation layers are overlaid on basedmaps from Esri57,58.
Informed by the vulnerability of renewable energy systems during evolving climate extremes, we propose a multi-scale spatiotemporal cascade model to quantify cascading power outages, featuring a temporal resolution compatible with the real-time operations of the decision-making system. Expanding the existing network cascade model that considers the overloaded line tripping and power flow redistribution induced by common-cause initial failures16,17,18,19,20, the proposed method further accounts for the impact of evolving hazards on system resilience. Under extreme weather conditions, system resilience/reliability is fundamentally determined by two key factors influencing power balance across different time scales: grid inertia for alleviating transient power imbalances and system flexibility for eliminating sustained power imbalances1. Our cascade model considers power imbalances associated with renewable energy integration by taking these two factors into account. In the context of large-scale renewable integration, reduced grid inertia against transient power imbalances is considered in the network stability analysis. System flexibility, considering reduced renewable generation and availability of flexible resources during climate extremes is embedded in real-time operation optimization (see Methods).
Catastrophic blackout of Puerto Rico in 2022
On September 18th, 2022, Hurricane Fiona caused a complete power outage across the island of Puerto Rico again after a similar situation caused by Hurricane Maria in 2017. During this system-wide blackout event, LUMA Energy, the local system operator that took over the grid in 2021, captured high-resolution spatiotemporal outage data27 in 10-minute intervals (i.e., at the real-time system dispatch scale). Such detailed data for a system-wide blackout caused by extreme weather events is rarely documented. Compared to regional-level power outage events, system-wide blackouts provide unique opportunities for exploring the weather-induced cascading failures and stability mechanisms of complex dynamic systems. This time-series outage data reveals a catastrophic cascading failure in the Puerto Rico power grid, with system outages escalating from below 50 to 100% within 10 minutes at 18:00 UTC, prior to the landfall of a mere Category 1 hurricane (Fig. 2a, b). Consistently, the US official report5 indicates that escalating damages to distribution and transmission infrastructure led to a system-wide imbalance between electricity supply and demand. This imbalance triggered the off-grid protection of generation units, resulting in system instability.
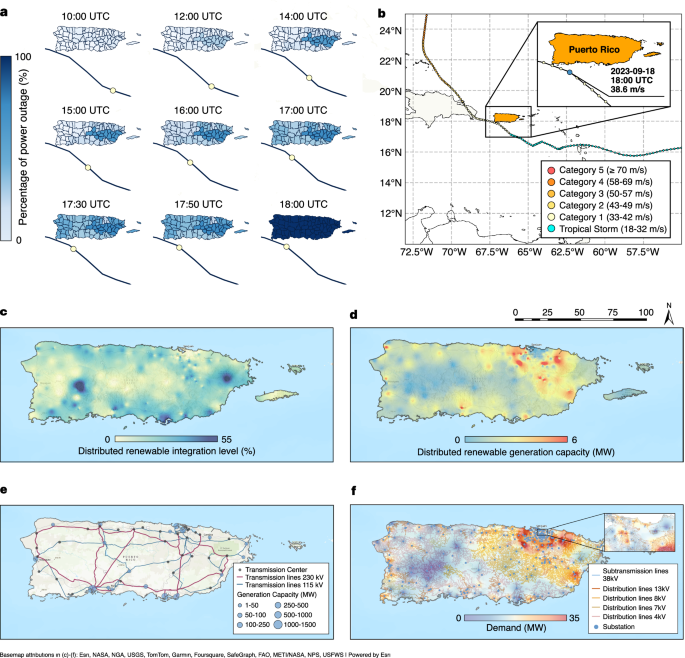
a Spatiotemporal power outage map of the Puerto Rico power grid from 10:00 UTC to 18:00 UTC on September 18, 2022, along with the track (black line) and center location (yellow dot) of Hurricane Fiona. b The track of Hurricane Fiona, highlighted by its maximum sustained wind speeds. Hurricane Fiona was a Category 1 hurricane during its landfall in Puerto Rico. c, d Maps of c the integration level and d the capacity of distributed renewable generation (rooftop solar systems; with data recorded at the distribution feeder level). e Transmission network with generation capacity. f Distribution network with the spatial distribution of demand. The power grid exhibits a supply-demand structure with major generation in the south and the primary load centers in the north (San Juan). The structure heightens the risk of power imbalance during disruptions of the transmission network. Despite certain distribution feeders reaching a renewable integration level of 55%, the overall integration level with a total installed distributed renewable generation capacity of 296 MW remains below 20% of the peak demand (2751 MW), approximately at 16%. The visualized data of (c–f) are overlaid on basedmaps from Esri57.
We used the CRESCENT model to perform spatiotemporal simulations of the Puerto Rico power grid during Hurricane Fiona, matching the 10-minute temporal resolution of the power outage data and real-time operation timescale. The energy-related models are configured based on the Puerto Rico power grid in 2022 with its utility-scale generation, distributed renewable generation, and transmission and distribution networks (Fig. 2c–f), corresponding to the conditions during Hurricane Fiona. Considering the uncertainty in infrastructure hazard resistance, we generated 1000 time-series power outage realizations, spanning from 0:00 to 23:00 UTC on September 18, 2022, to capture the full impact of the hurricane hazard on the power system. The spatiotemporal failures of each infrastructure type are assessed based on the corresponding fragility functions described in the Methods section. While the cascading failure is due to the comprehensive effect of hurricanes on generation capacity (including distributed renewable generation) and both transmission and distribution networks, the early stage of outages (before 14:00 UTC) is primarily driven by losses in the distribution networks, which have comparatively lower hazard resistance than transmission network infrastructure (see Fig. S17). In addition, initial minor transmission network failures are less likely to cause severe cascading failures due to the redundancy of transmission network connectivity and protective mechanisms inherent in its design.
As the hurricane approaches with increased hazard intensity, distribution networks experience more severe damage, and solar-based renewable generation undergoes higher reductions. Although the direct physical damage to solar panels is relatively low (below 1% on average) during this Category 1 hurricane (see Fig. S18), the indirect effect of the hurricane’s cumulonimbus can still reduce solar generation. For instance, by 16:00 UTC (12:00 local time), distributed solar generation across the island declines to only 26.8% of generation under clear sky conditions, with a reduction of over 125 MW generation (See Fig. S15). These factors can result in substantial supply-demand imbalances within a short timeframe (e.g., a 10-minute control cycle of system real-time operations). Under these conditions, system operations with limited flexibility may fail to fully resolve power imbalances, thus necessitating proactive load shedding and leading to a precipitous decline in customers served—a critical indicator of system resilience during extreme events. Moreover, the grid faces a higher failure risk of transmission towers and lines under the intensifying hazard (see Fig. S17). Transmission line tripping, which transfers power flow to remaining lines, can lead to line overloads and potentially trigger cascading failures. In the worst-case scenario, insufficient grid inertia against substantial transient imbalances can destabilize the grid, resulting in a catastrophic blackout. Among all the realizations, 60% result in catastrophic blackouts with complete system-wide outages. The occurrence of these catastrophic blackouts peaks at 18:00 UTC, the same time as for the real-world case (Fig. 3a).
Additionally, we identified the largest failure (the greatest decline in customers served) of each realization (Fig. 3b). In the majority of the realizations, the largest failures occur between 17:00 UTC and 19:00 UTC with 40–55% of customers served. During this period, the hurricane was closest to the island and generated the highest winds (Figs. S4–S10). The power system had been progressively weakened by cumulative damages, including less robust topology connection and decreased system flexibility and grid inertia. Subsequent failures could then directly devastate the power grid. These findings closely align with the real-world catastrophic blackout incident, highlighting a high-risk state for a weakened system. The second peak of the largest failures is at a relatively early stage, between 15:00 UTC and 16:00 UTC. Since the hazard resistance of components varies through sampling from the resistance distribution in each realization, realizations with early timing of the largest failures in the system indicate the existence of critical components—whose failure is associated with higher impacts on customers served. These failures correspond to scenarios in which critical components were assigned lower resistance within hazard resistance distribution. Failures of critical components could contribute to severe degradation of the system by triggering cascading failures or grid splitting, even at the early stage when the hazard is less severe, and the system is not yet largely weakened.
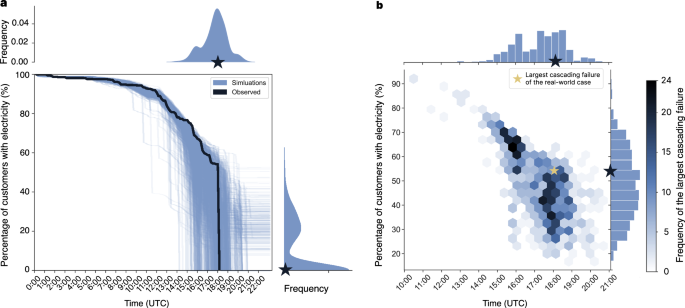
a Comparison of the percentage of total customers with electricity between the simulated and observed cases for the Puerto Rico power grid during Hurricane Fiona on September 18, 2022. The 1000 simulated cases (blue) are generated from the proposed CRESCENT model with the grid configuration as of September 2022. The observed peak outage representing the degradation of customers with electricity (black) is obtained from the US power outage datasets27 recorded by local power utilities. The right-side subfigure shows the distribution of final system statuses (percentage of customers with electricity) across all simulations. The top subfigure shows the distribution of the times when catastrophic blackouts (100% failure) occurred across all catastrophic blackout cases. b Distribution of the largest failures. The largest failure in each power outage realization is identified by the largest drop in the percentage of customers with electricity between two successive simulation time steps. A darker color in a hexagon indicates a higher density (frequency) of data points within that area. The top and right histograms show the distributions for times and system statuses, respectively, where the largest cascading failures occurred. Black stars in the top and right distributions mark the position of the observed case.
Resilience patterns
Resilience is a multi-dimensional concept encompassing pre-event planning, during-event resistance, and post-event restoration according to the “resilience trapezoid” framework28,29. Under a predefined grid configuration, the occurrence of a system-wide catastrophic blackout during an extreme event serves as a critical indicator of system resilience. Restoring a system from a system-wide blackout—“black start”, is considerably more challenging than recovering a functional grid with partial outages, as it requires substantial effort to restore the system-level balance and synchronization30. Thus, to further explore system performance against this extreme event, we categorized all the realizations into resilient (without system-wide power outages) and vulnerable (with system-wide power outages) sets (Fig. 4a, b). It is noted that the resilient cases experience their largest failures considerably earlier than the vulnerable cases. This result suggests that systems that experience relatively severe failures, causing the largest drop in customers served but still maintaining adequate functionality (e.g., above 50% of customers served) during the early stage rather than the late stage of the event, can be more robust to ride through subsequent damages under increasing hazards (Fig. S20). This finding indicates that passive early degradation might enhance system resilience. This resilience pattern, previously unidentified, reflects a similar philosophy of proactive de-energization measures, such as controlled rolling blackouts31 implemented in Texas during Winter Storm Uri in 2021 by reducing the grid’s burden and mitigating energy imbalances to prevent system-wide failure.
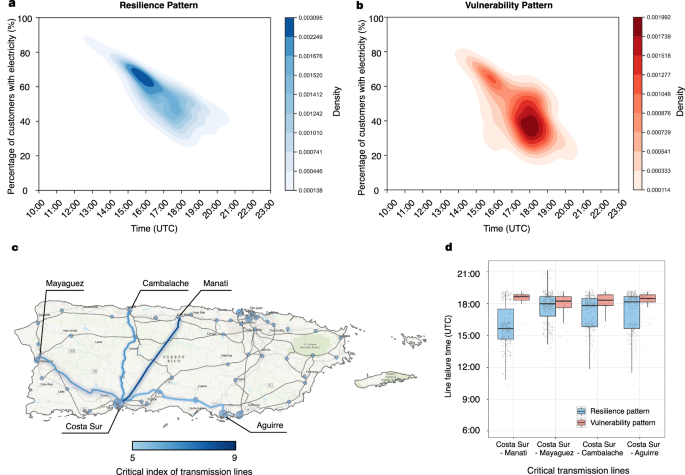
a Resilience pattern. The kernel density estimation of the largest failure (the greatest drop in customers served) in each resilient case (where the grid survives without a complete blackout) among the 1000 realizations. The darker color (blue) represents areas where the largest failures occur in the majority of resilient cases. b Vulnerability pattern. Similar to (a) but for vulnerable cases (where the grid experiences a catastrophic system-wide blackout) among the 1000 realizations. c Identified critical transmission lines in the transmission network. The critical index for a transmission line is defined as the proportion of instances where its failures directly contribute to catastrophic blackouts (a 100% complete outage occurs as soon as the line fails) across all realizations. Only those lines with a critical index higher than 5% are highlighted (blue), while the remaining lines are colored in gray. The names of substations associated with these critical lines are labeled. The transmission network with highlighted critical lines of (c) is overlaid on a basedmap from Esri57. d Resilience and vulnerability patterns of the top four critical transmission lines. The resilience pattern boxplots (blue) show the distributions of line failure times in instances where the system ultimately remains functional despite the failure of the corresponding lines. The vulnerability pattern boxplots (red) show similar distributions in instances where a catastrophic blackout occurs following the failure of the specific lines. Tiny gray dots represent individual data points. The horizontal black line within each box indicates the median, box edges show the interquartile (50%) range, and whiskers extend to the 5th and 95th percentiles.
The disparity in resilience and vulnerability patterns observed at the system level further motivates our considerations of how the failure timing of individual components, especially those with the most impact, affects system resilience. To identify these critical components, we define the critical index of a transmission line as the proportion of instances where its failures directly contribute to catastrophic blackouts among all realizations. The top four critical lines (Fig. 4c), all connected to Costa Sur—the largest power plant complex in Puerto Rico, play a vital role in the connectivity of transmission network topology, such as delivering electricity to the north region and establishing connections with the second-largest power plant complex (Aguirre). Regardless of this specific weather event, the steady-state topology analysis based on the current flow between centrality also suggests Costa Sur has the highest importance for grid resilience (see details in Supplementary Note 3).
The resilience patterns of these critical transmission lines (Fig. 4d) suggest that earlier failures of these critical lines (when the system maintains relatively adequate functionality) tend to enhance overall system resilience, consistent with the resilience patterns at the system level (Fig. 4a, b). When critical components fail early, the system remains relatively robust with sufficient network connectivity, greater flexibility, and higher grid inertia due to higher availability of generation capacity. These factors enable the system to manage power flow redistribution caused by critical component outages, reducing the likelihood of early failures escalating into a system-wide collapse. Additionally, early failures of critical components can potentially activate load-shedding mechanisms, unintentionally de-energizing the grid, which further reduces the magnitude of supply-demand imbalances caused by subsequent component failures. In a later stage, during the extreme event, the system is compromised in network connectivity, and the disruptions of critical lines followed by the large-scale power flow redistribution can overload the remaining lines, which may result in further overloads and incur cascading failures. Moreover, in a weakly connected network, the removal of these critical lines that connect to the highest-centrality node can lead to network segmentation, causing substantial power imbalances in the sub-networks and potentially leading to instability. By comparing the system’s response to critical component failures occurring early (before the median failure time of all realizations) and late (after the median failure time of all realizations), we found that early-stage failures of these critical components exhibit a lower probability of triggering cascading failures than late-stage failures (Fig. S19). To further validate this finding, we preset the hazard resistance of the most critical component (Costar Sur–Manati) to be either the weakest or the strongest among all components. When this critical component ranks within the weakest 1% and 10%, the probability of catastrophic blackouts under this extreme event is reduced by 17% and 9%, respectively. While scenarios featuring the critical component with higher wind hazard resistance exhibit increased failure probability (see Fig. S14).
Sensitivity analysis of increasing renewable integration
To explore the effects of increasing renewable integration, especially unregulated BTM distributed solar PV systems, on the risk of catastrophic blackouts, we conduct a sensitivity analysis using the proposed CRESCENT model under the same hurricane event. Here, we generate 1000 realizations considering the uncertainty in infrastructure resilience for each of the renewable integration levels ranging from 10% to 80%, where the renewable integration level is defined as the proportion of demand met by solar PV systems. Despite some BTM solar systems being equipped with energy storage for consumer self-sufficiency, such systems are not well regulated and dispatched by the grid operators and can even undermine grid resilience due to their individual optimal strategies12. Therefore, to isolate the impact of BTM solar systems and simplify the sensitivity analysis, we first investigate scenarios where the BTM solar integrations are configured without additional storage and set to operate in the widely adopted maximum power point tracking (MPPT) mode32. To eliminate regional variations, we proportionally adjust the renewable integrations according to the demand profiles of distribution feeders, ensuring a consistent level across the entire island.
By comparing these realizations, we observe a nonlinear effect of increasing environment-sensitive renewables on potential catastrophic blackouts (Fig. 5). Below a renewable integration level of approximately 45%, including the current level of 16.1%, realizations exhibited similar probabilities of catastrophic blackouts and nearly identical failure patterns. This phenomenon suggests that below this level, the risk introduced by the growth of solar generation has a minimal impact on system resilience. This can be attributed to the real-time energy balances between supply and demand remain primarily managed by adequate conventional generation, which is relatively more resilient to extreme weather impacts.
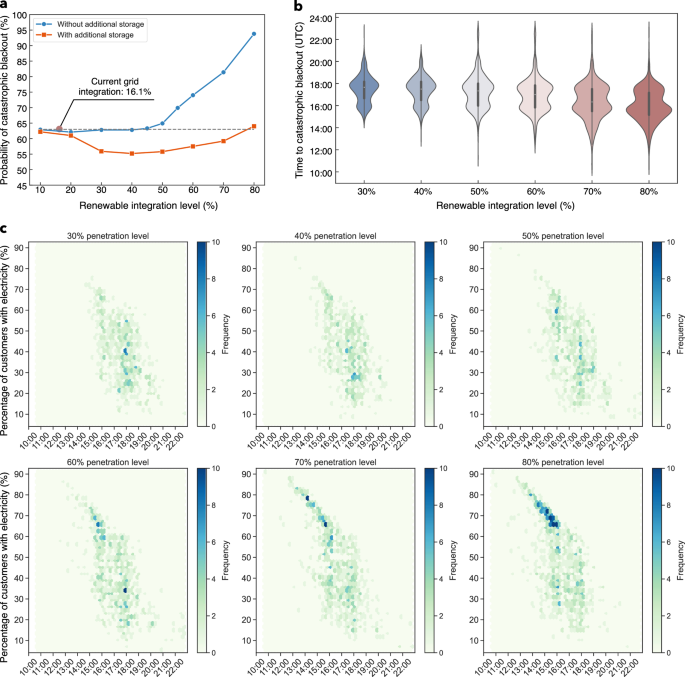
a Probability of catastrophic blackout occurrence at varying levels of renewable energy integration. The current grid (during the same period as Hurricane Fiona) with an average renewable integration level of 16.1% is marked by the red dot. The blue and orange curves show scenarios without and with additional storage, respectively. b Violin plots for the time distributions of catastrophic blackouts at varying levels of renewable energy integration without additional storage. c Distributions of catastrophic blackout occurrences at different renewable integration levels without additional storage. Each data point in the plots records the time of a catastrophic blackout occurrence and the corresponding system status (percentage of customers with electricity). A darker color in a hexagon indicates a higher density (frequency) of data points within that area. The probability for each blue point in a and the violin plots in b were calculated based on 1000 realizations generated by the proposed CRESCENT model at a specific renewable integration level under Hurricane Fiona. In the violin plot, each violin represents the distribution of system-wide blackout occurrence times at a specific level of renewable energy integration. The width of each violin indicates the frequency (probability) of blackouts at different times. The black bar within each violin shows the interquartile range, and the inside white dot represents the median time of catastrophic blackout occurrence. A larger violin size in (b) indicates more catastrophic blackouts.
However, as the renewable integration level in the system further increases, the effects of renewables begin to emerge with the failure probability exhibiting a super-linear growth (Fig. 5a). Under a high renewable integration level, the extreme weather event substantially diminishes solar-dominated generation due to wind damage and cumulonimbus cloud cover, which enlarges energy imbalances between supply and demand and further challenges grid inertia and flexibility for maintaining system stability. Therefore, the system becomes more likely to experience a catastrophic blackout at an earlier stage (Fig. 5b).
The temporal distribution of catastrophic blackouts under various renewable integration levels (Fig. 5c) more clearly demonstrates that in a renewable-dominated scenario with over 70% renewable integration, grids face significant challenges in managing even the lower intensity of hazards at early stages, despite having less cumulative damage and relatively higher system functionality (above 65%). Conversely, under the same hazard, grids with lower renewable integration (below 50%) exhibit higher resilience during the initial phases. This difference is primarily attributable to the substantial reduction in power generation of the solar-dominated power system caused by the indirect effect (cloud cover) of hurricanes on such environment-sensitive renewables (see Fig. S16), which exacerbates energy imbalances.
We further examine the scenarios where each 1 MW of BTM solar integration is paired with 0.5 MW (2 MWh) of energy storage, as projected by the Puerto Rico Demand Response Impact and Forecast Tool33. The storage systems are considered to contribute to mitigating short-term grid imbalance by providing virtual inertia through droop control mechanisms34 (see Supplementary Note 9 for detailed parameters). At the transmission network level, these energy storage systems are modeled as being aggregated at the transmission nodes associated with their respective distribution networks. When the integration level is between 20 and 70%, the energy storage systems mitigate the increased risk from BTM solar integration and even reduce the probability of catastrophic blackouts (Fig. 5a). Due to their inherently distributed nature, energy storage systems balance inertia distribution across the grid, thereby enhancing the survivability of sub-grids during grid-splitting events. However, at higher renewable integration levels, the substantial reduction in solar generation during hurricanes may still pose challenges to maintaining the system’s energy supply-demand balance, causing an increase in the probability of catastrophic blackouts.